

Tesla - The $1 Trillion Company
Tesla - The $1 Trillion Company
Dear investors,
Welcome back to Thursday’s free newsletter, where we discuss investable assets by their history, current and future outlook with technical analysis.
With Tesla’s stock reaching above $1 trillion dollars in market cap, we are revisiting our charts to see how the stock performed after our last technical point of view. And if buying now is a good decision to make, or to wait for better opportunities.
Topics we will discuss:
Why did $TSLA just go parabolic?
Technical Analysis
Conclusion
Latest news
Tesla hit a $1 trillion market cap on Monday by the following news, Hertz (American car rental company) is ordering 100,000 Tesla vehicles to build out its electrical rental fleet by the end of 2022. For Tesla, it is the largest purchase order ever of their electric vehicles and they will make around $4.2 billion out of this deal.
On Monday when the news was released, Tesla’s stock price skyrocketed to more than $1045 a share making a new all-time high. The stock closed up 12.66% at around $1025 a share. The following day the price extended further to almost $1100 a share, but declined immediately thereafter in the trading hours.
Further news is the strong sales in the European region and updated bullish analysts, Morgan Stanley’s Adam Jonas raised his price target from $900 to $1200 on Sunday. Jato Dynamics said Monday that Tesla’s Model 3 became the first fully electric vehicle to top new car sales overall in Europe in September.
As of this week, Tesla has officially joined the trillion-dollar market cap club like Microsoft, Amazon and Apple.
Technical Analysis
$TSLA — Daily Chart
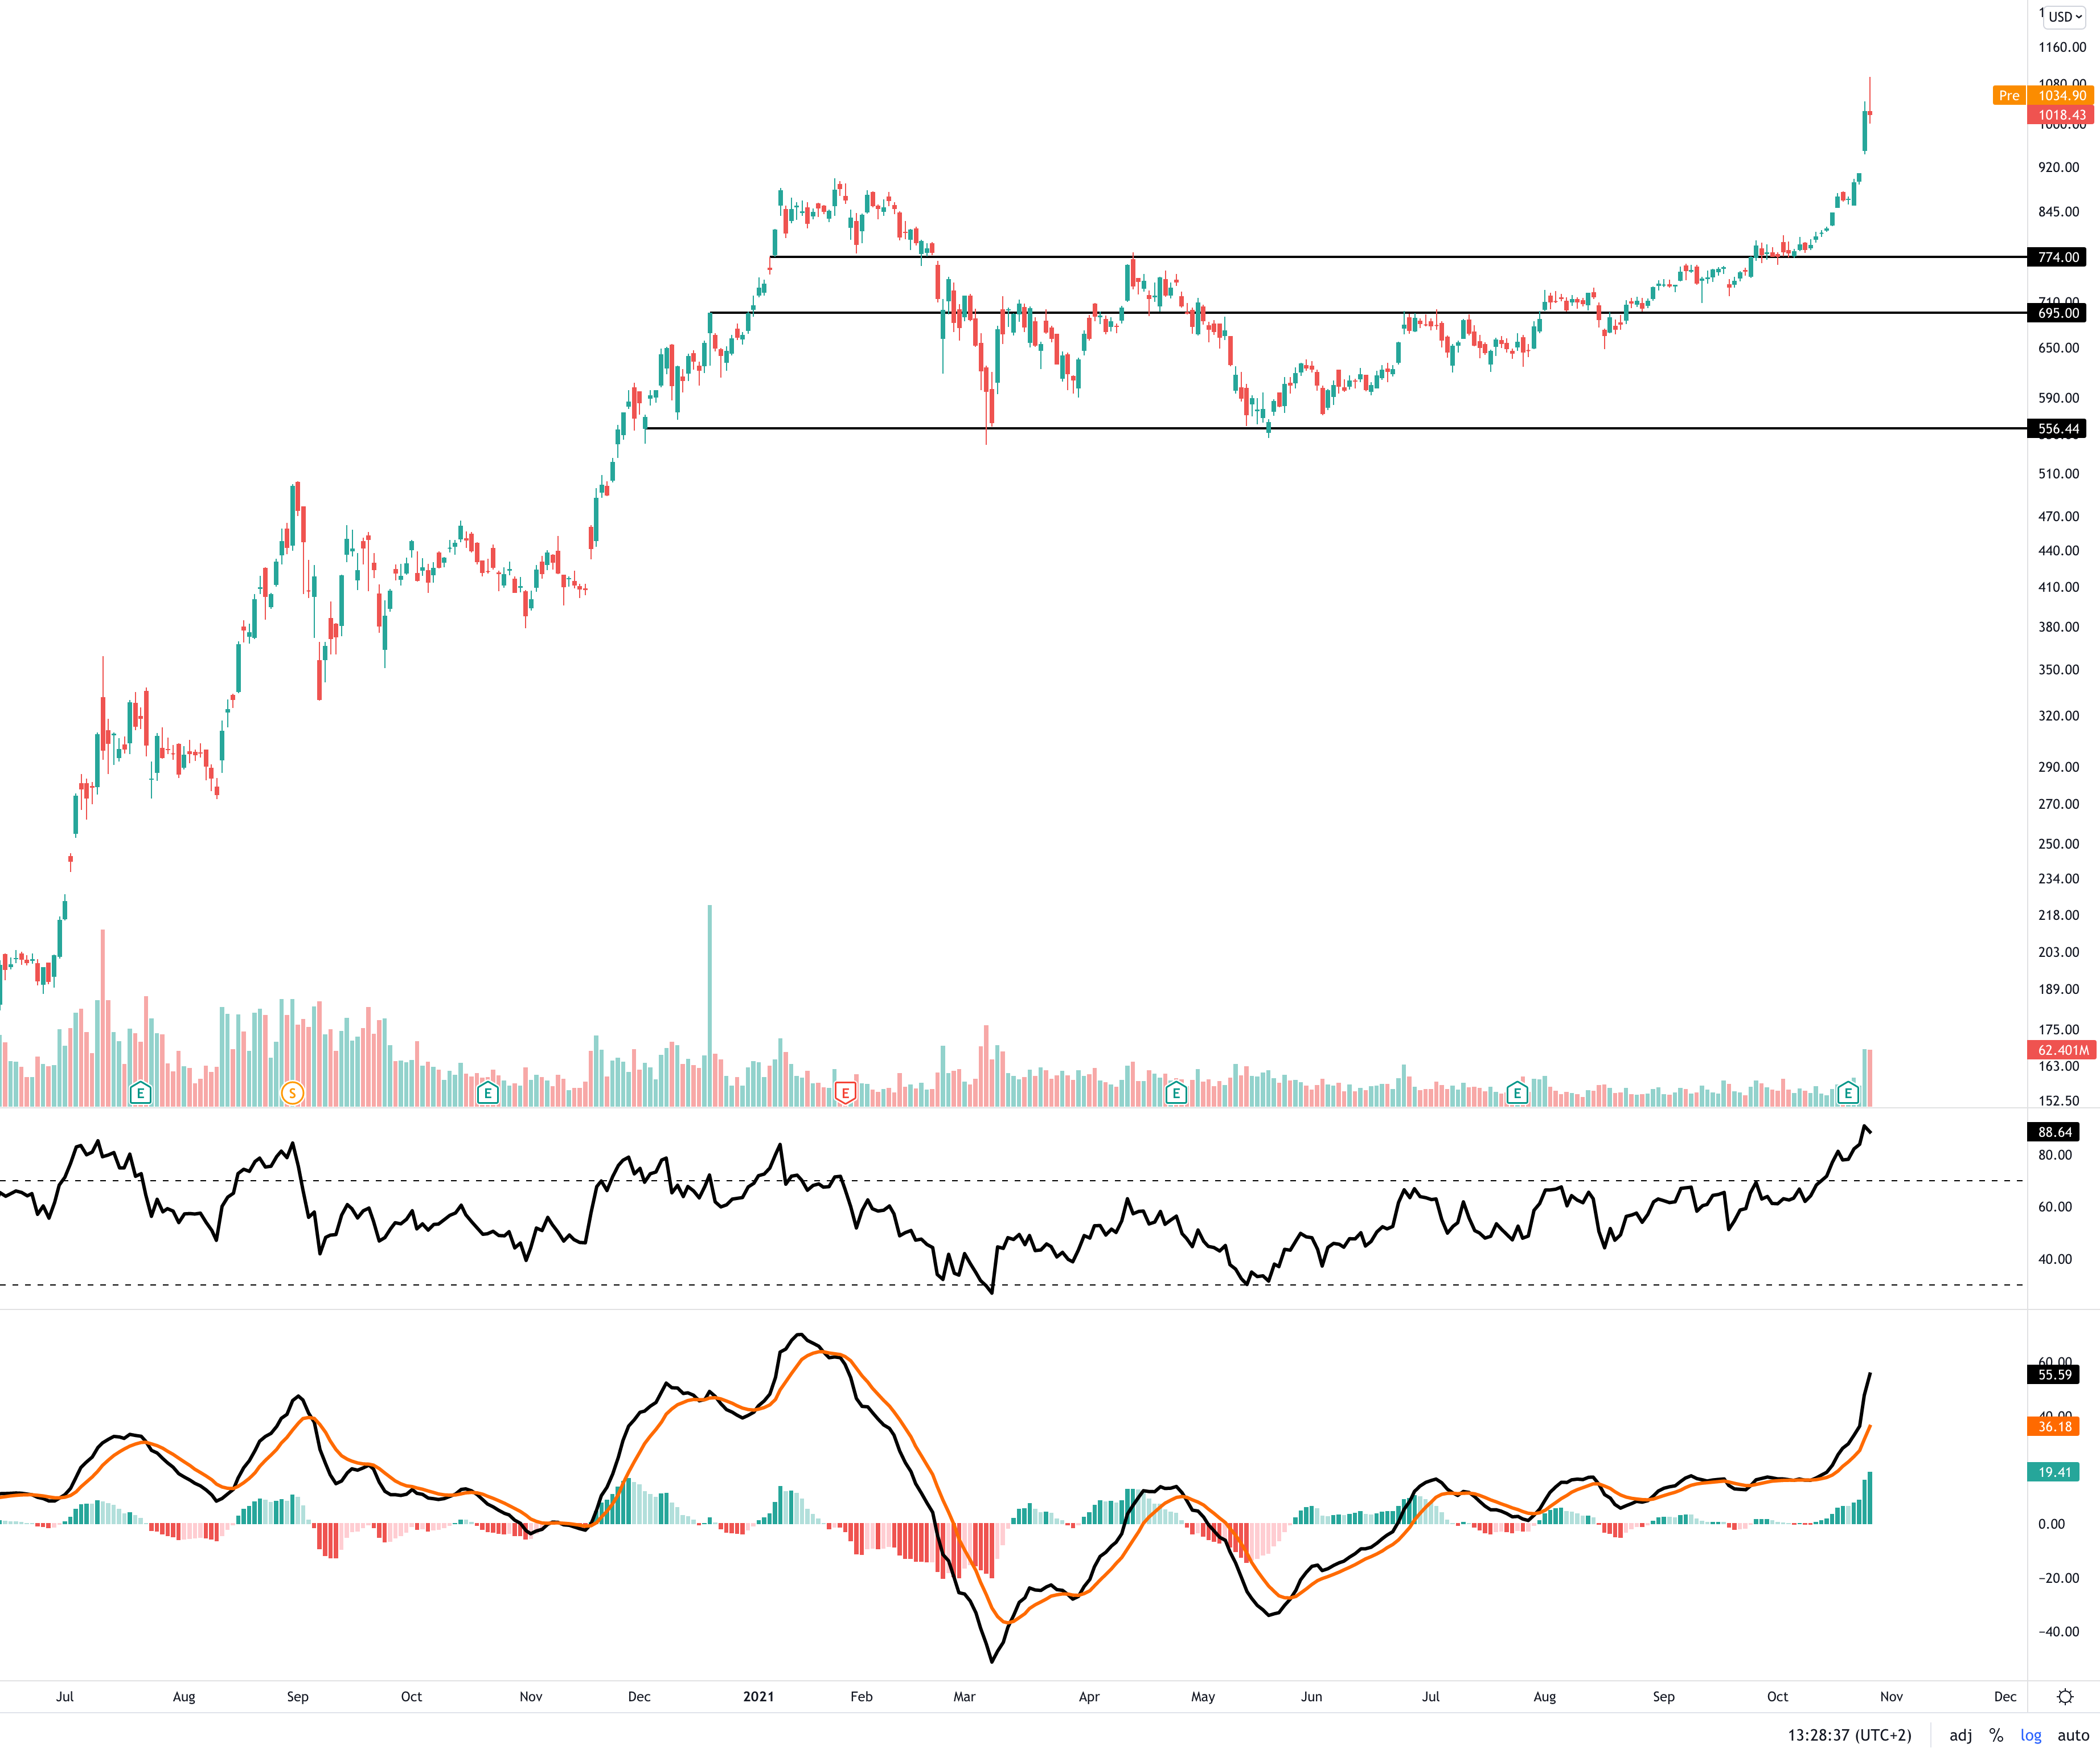
At the time of writing, Tesla’s stock is trading aggressively and is in a parabolic state. How long and how high this parabolic state will last is unknown, but if we just focus on the fundamentals, we can clearly see that the price of the stock is overextended.
If we look at the technical indicators we can conclude that with the RSI at around 90 the stock is overbought for the time being. However, the MACD is indicating a strong bullish momentum, so while the RSI is saying that the price is overbought, we may see even higher prices in the short-term.
We believe this parabolic move is partly the cause of the phenomenon called FOMO (Fear Of Missing Out) and since we see ourself as value investors, we are not interesting to enter new positions at these levels.
Note: This chart has the exact same trend lines as our previous Tesla newsletter and worked perfectly to buy and sell positions.
$TSLA — Weekly Chart
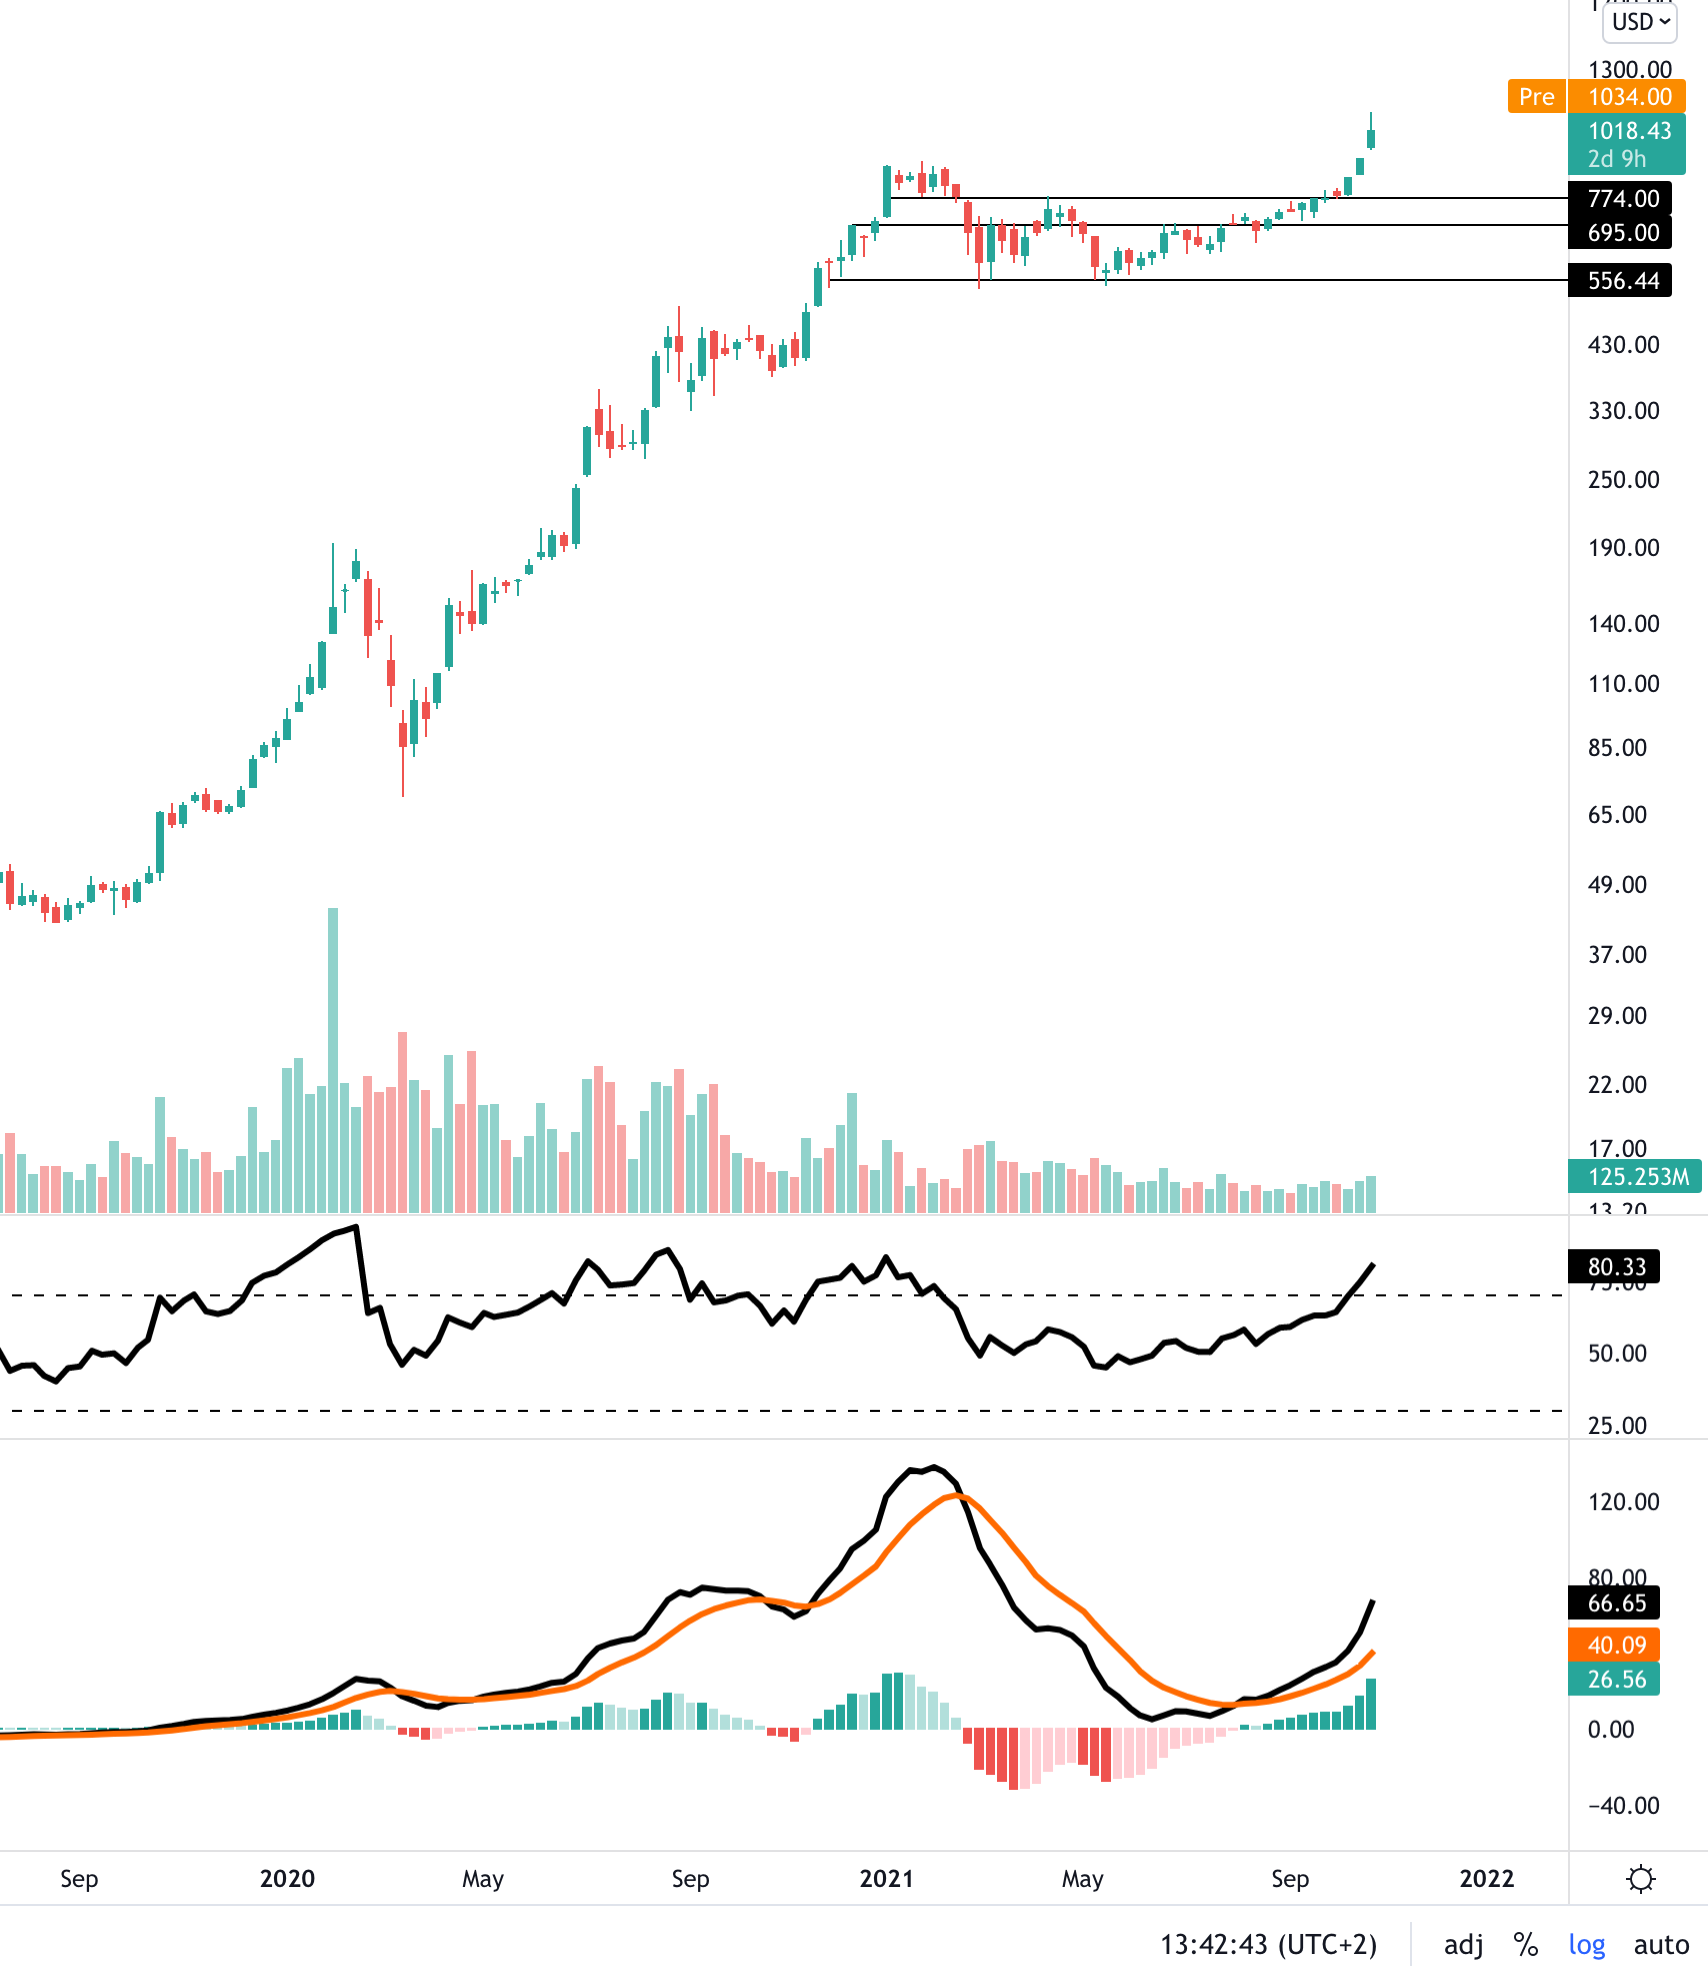
If we zoom further out into the weekly time-frame, we can see that even with the RSI above the overbought reading (70), the MACD momentum is making a strong move towards the upside because of this parabolic move in price. This indicates potential further upside, but risk absolutely remains at these overextended levels.
Conclusion
In the recent quarter, Tesla’s China sales have grown to nearly half the size of the company’s U.S. sales and Europeans are buying more Tesla’s than ever. We believe that the demand for electric cars is accelerating and likely will continue in the long-term.
But Tesla’s current valuation is too high to justify a valuable investment, so if we wanted to invest in Tesla, we would wait for better market conditions.
We would like to thank you for your time reading our newsletter, if you found something interesting, consider to subscribe and share this newsletter with your friends. We would highly appreciate it!
Never mis out on big market news by following us on Facebook, Instagram or Twitter.