


Market Overview [21] - New Year, New Opportunities
Dear investors, we hope you had a good New Year's Eve.
Welcome back to the Market Overview, where we provide technical analysis about the financial markets. On top of that, we deliver crucial market information that can influence financial markets to be always a step ahead of major market movements.
With a whole new year ahead of us, we are providing our thoughts on how the major indexes will perform in the coming months, what we believe will happen when interest rates are going back up and much more!
S&P 500 - Daily Chart

The S&P 500 index closed at $4766.19, just below the mid-term trend line. While this is a bearish development for the time being, we believe that to be temporary.
While we are still in an easy monetary policy of the FED, the economy is still booming and we expect in the coming three months that the stock market will soar to unbelievable high prices before it crashes back down.
The reason why we believe this will happen is because when the Federal Reserve will increase interest rates in the coming months, it directly causes the economy to slow down, inflation will cool off (deflation progress will start) causing investable assets to have much more downside pressure (red arrows in the chart).
Dow Jones - Daily Chart
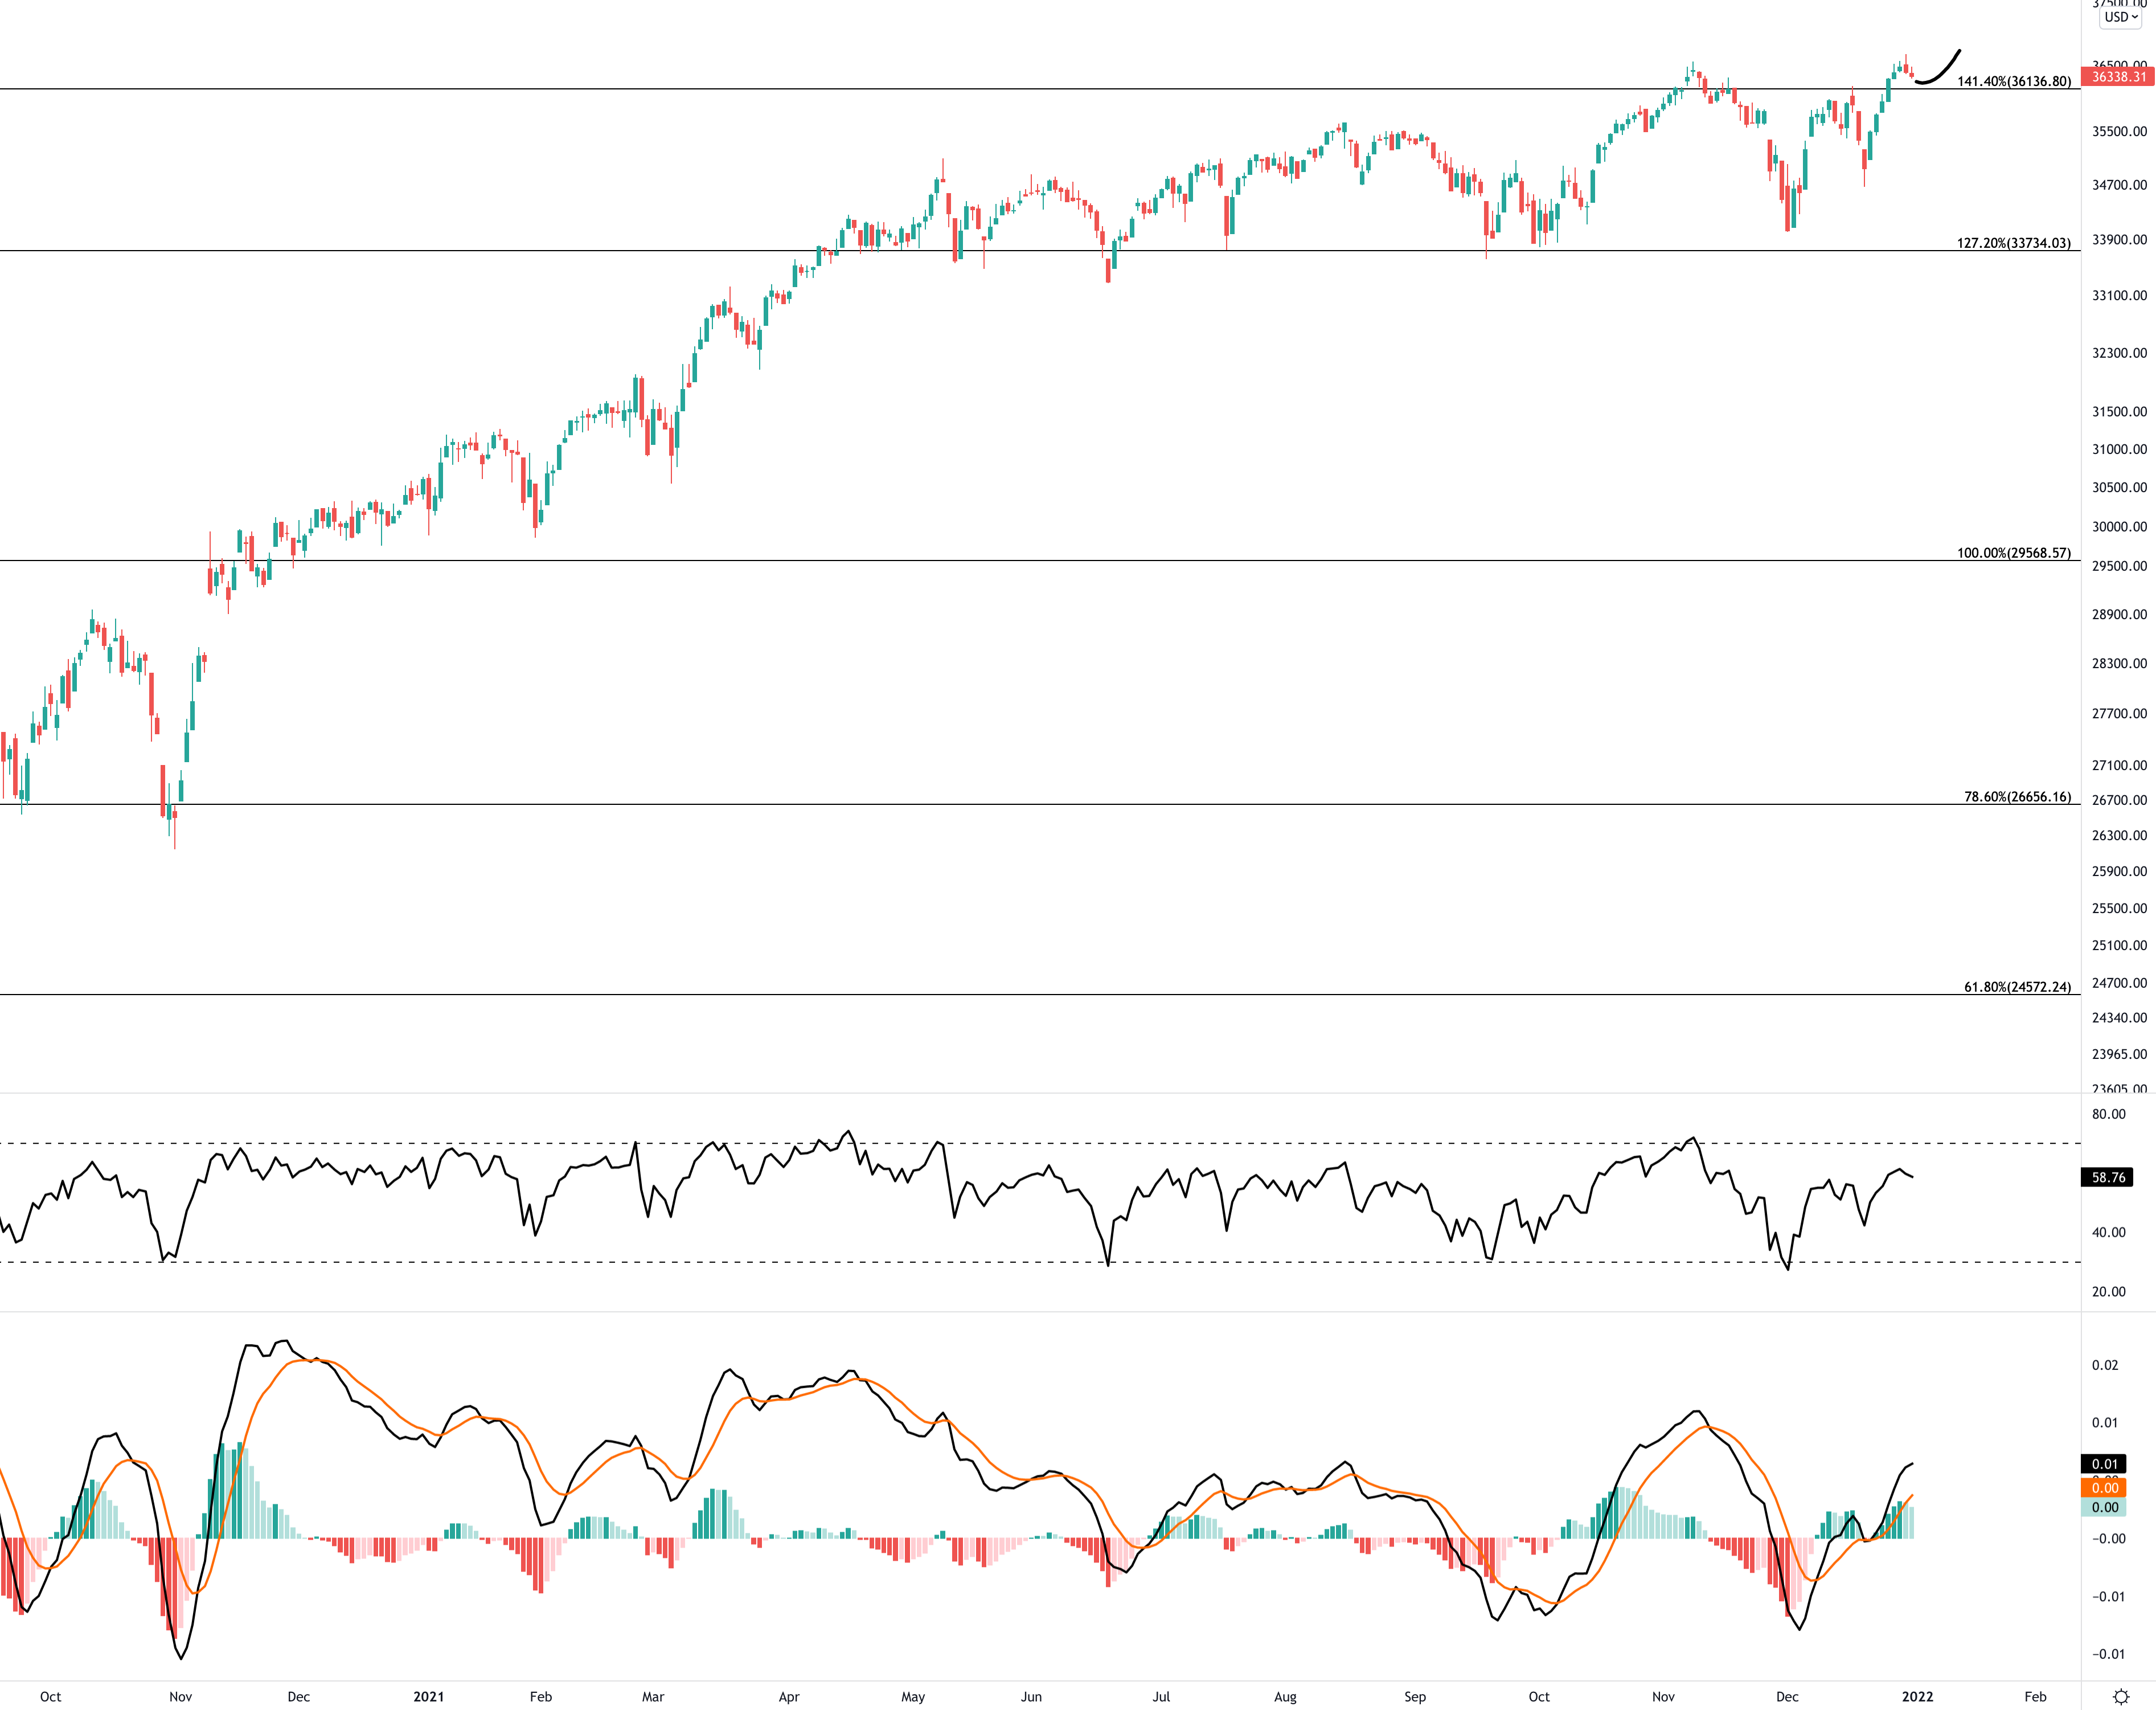
The Dow Jones index is trading at $36338.31 and recently broke its all-time high. We are expecting are retest on nearby support before continuing its uptrend.
Like the S&P 500, we believe the same future outlook will happen to the industry index.
Nasdaq 100 - Daily Chart
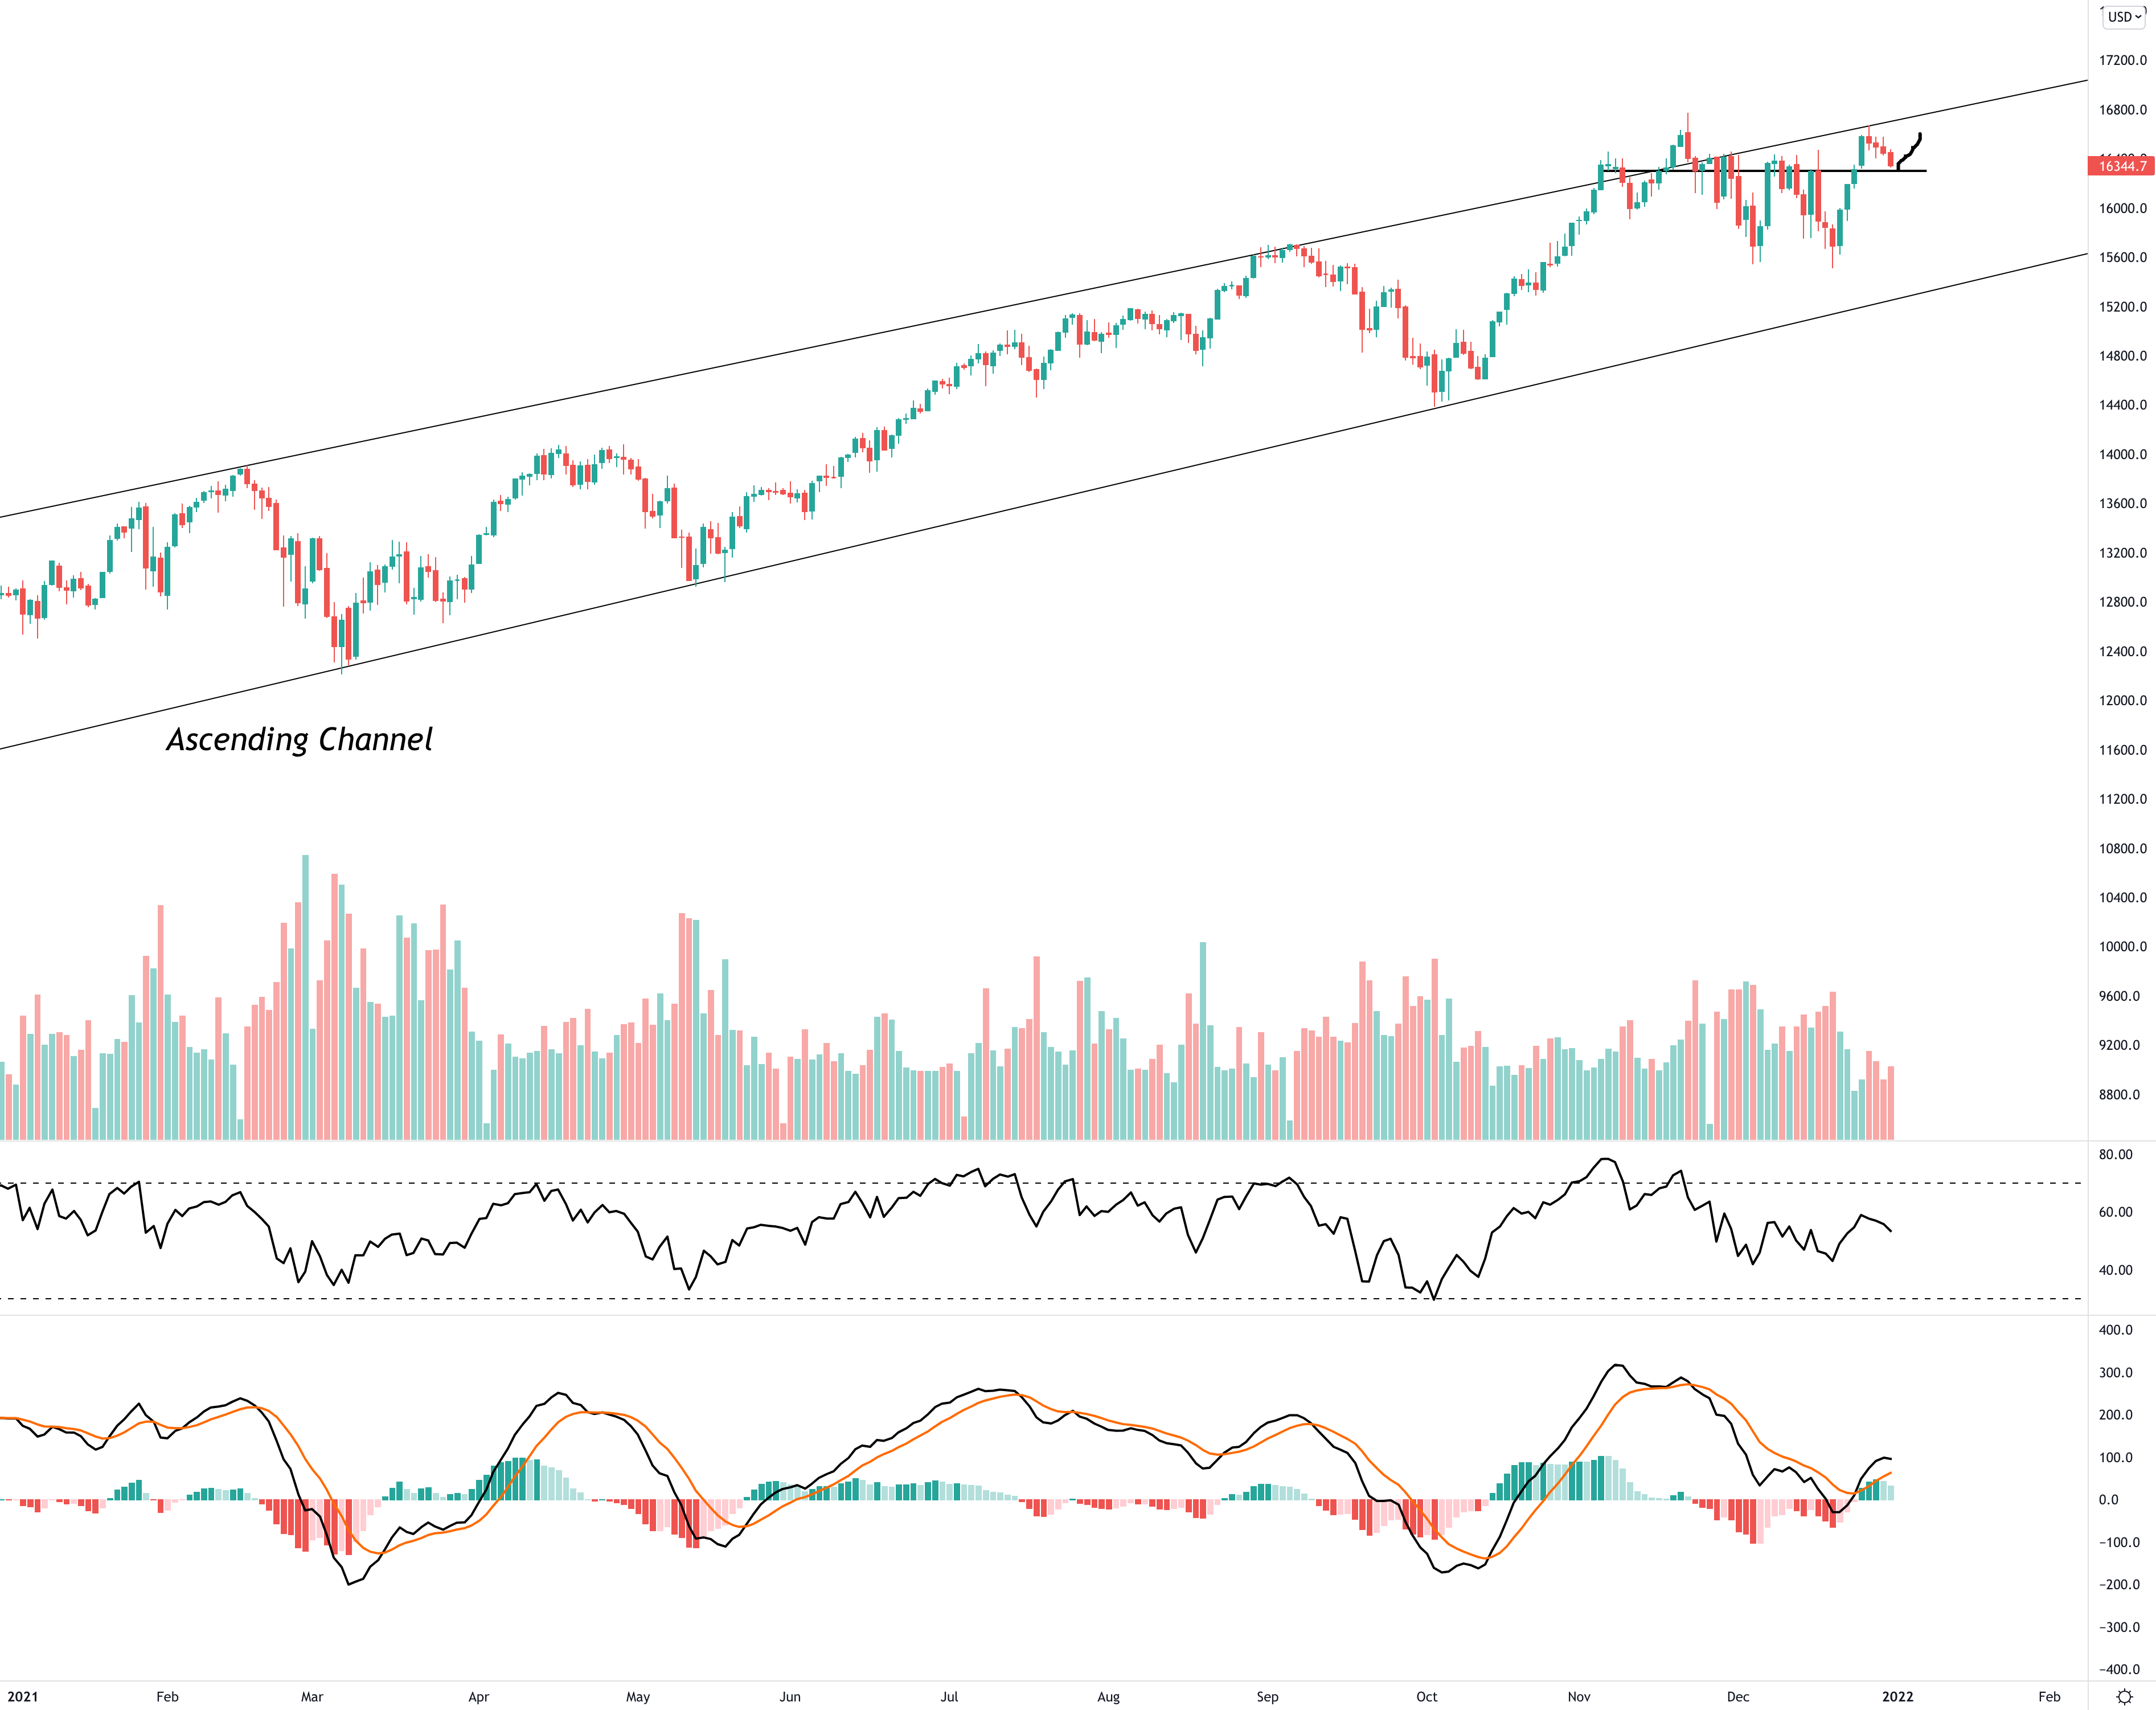
The Nasdaq 100 index is trading at $16344.70 and tried to break the ascending channel again. While it rejected on resistance, we expect in January that the Nasdaq 100 will break through it, sending technology stocks towards much higher levels.
Around $16300 is the nearest support, and we expect that the index will hover around that price before continuing its uptrend. If not, we believe that the index will not decline further under $16k.
AEX - Daily Chart

For our Dutch subscribers, Netherlands main index closed at €797.94, just below local resistance. While multiple failed attempts where made to break through resistance, we expect in the coming days to weeks the AEX will break its last resistances and is moving back towards it all-time high.
If the AEX decides to decline first, the first support would be €791 and the second one around €783.
Bitcoin - Daily Chart
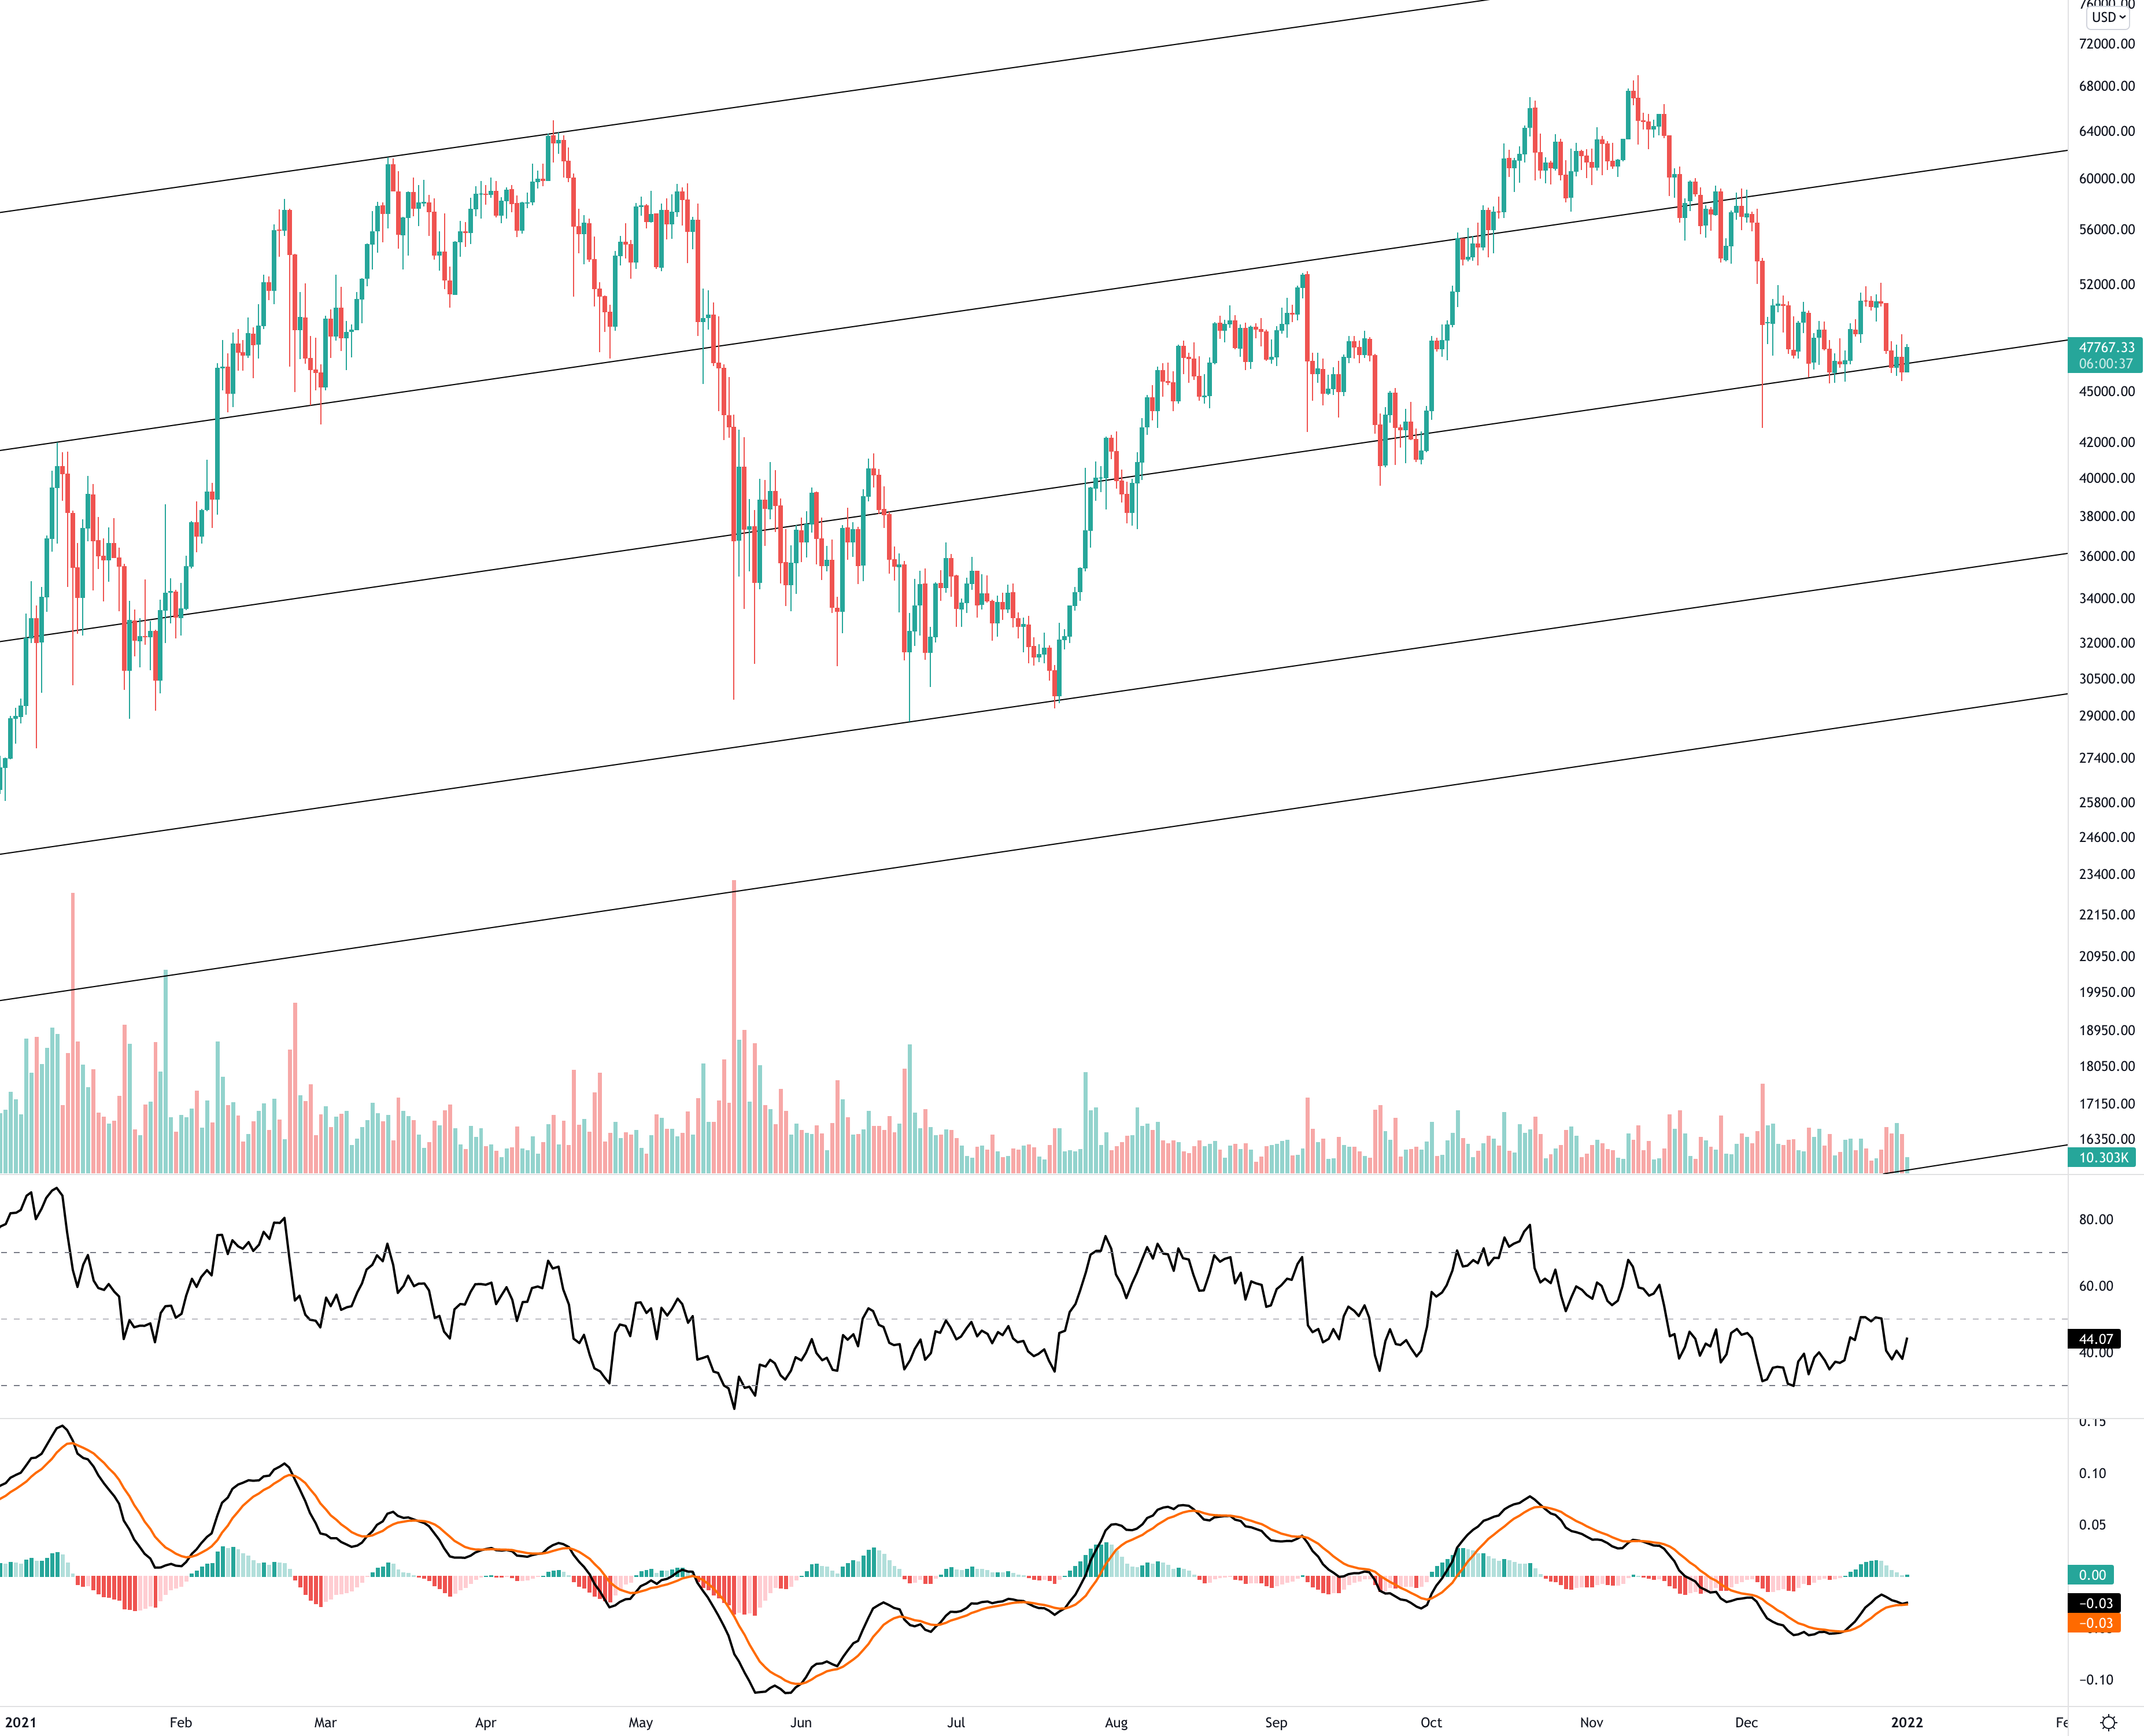
Back to crypto, bitcoin is at the moment of writing $47700 and is just trading back above the local trend line acting as support. We believe that the bottom for bitcoin is in and we expect more upside in the coming months.
On a technical point of view, the RSI indicator is showing multiple week’s of bullish divergences (RSI has higher highs but price is making lower highs). The MACD indicator is also making a bullish divergence and we expect that the signal line to bounce off of it in the coming days.
We would like to thank you for your time reading our newsletter, if you found something interesting, consider to subscribe and share this newsletter with your friends. We would highly appreciate it!
Never mis out on big market news by following us on Facebook or Twitter.