

Market Overview [10] - U.S. Monetary System explained
Market Overview [10] - U.S. Monetary System explained

Every 5th Market Overview is available for everyone!
Dear investors,
In this special newsletter we will explain in easy terms on how the U.S. monetary system works and why the debt limit is so important. If you understand this, you understand the whole U.S. economy. And of course we end with technical analysis of the mayor indexes, including a up-to date Bitcoin chart.
Topics we will discuss:
U.S. Monetary System
U.S. Debt limit
Our view on the system
Technical Analysis
Government
It all starts with the government where new politicians promise free stuff more than their opponent, when this happens the United States needs to spend more than its incomes, what is called deficit spending. To pay for that deficit spending the Treasury borrows currency by issuing bonds, a bond is basically a piece of paper with IOU on it so they can borrow currency now and pay it back in the future plus interest. Basically lending prosperity from the future to use it today.
Printing currency
With the treasury holding all these bonds, they decide to give an auction with the big banks. The banks compete with each other to buy those bonds (buying a portion of the U.S. debt) to make profit on it by earning interest.
But it isn’t stopping there, the banks are swapping those bonds they bought with the Federal Reserve at a profit (interest). The Fed writes checks (cash) in exchange and keeps the bonds what still receives its interest.
But how is the Fed paying for those bonds?
“When you or I write a check there must be sufficient funds in our account to cover the check, but when the Federal Reserve writes a check there is no bank deposit on which that check is drawn. When the Federal Reserve writes a check, it is creating money.”
- “putting it simply”, Boston Federal Reserve.
The Fed hands those checks to the banks and new currency springs into existence. Now, the banks have new currency to spend and they are buying more bonds on the Treasury’s auction. This cycle repeats on and on, but keep in mind that the checks that the Fed creates is also a IOU, so the banks have to pay the checks back later.
The end result of all of this is that The Federal Reserve builds up a ton of bonds and the Treasury build up a lot of currency, using the banks as middle man.
The problem with banks
With the Treasury having all that new currency, they decide to deposit that into various branches of the government, then the government does some deficit spending on healthcare, infrastructure and war.
Thereafter all that currency enters the economy and into people’s bank account who work for those branches. The problem we now face is that if you store currency into your bank account, the bank can lend out almost all your currency into risky assets whereby they make massive amounts of profit. This is also known as fractional reserve lending.
But if the banks lend out your money, they replace it with IOU’s (bank credit), so if you deposited $100 into your bank account and the banks can lend out 90% of it, there is now a total of $190 dollars typed into existence.
The problem is that banks are expanding the currency supply. If the currency supply is growing, every dollar gets less purchasing power, also known as inflation.
This is where the vast majority of our currency supply comes from.
Debt ceiling
The debt ceiling is only a political matter whereby the apposed political party wants to kick the ball to the other party. Nobody wants to increase the debt limit, but if the debt limit would not be raised and the economy would default for the first time. The whole economy would eventually collapse because it is surviving on new debt to pay off the remaining bills and bond holders.
Conclusion
Everything we described is the entire currency supply, basically nothing but a supply of numbers. Some of them printed, most of them typed by the banks through IOU’s.
We believe the monetary system will eventually fail like every fiat currency in the past. With U.S. debt at almost $29 trillion and rumours that the debt ceiling has to be eliminated because of the fear of defaulting. We expect that the debt will overwhelm the country sooner of later and need to return to a gold-backed system, like in 1971 before the ‘Nixon shock’.
Technical Analysis
S&P 500 / 1D-chart

The S&P 500 is trading at lower prices and is in a short-term downtrend, with two reaction on the long-term trend line, we believe we can expect short-term upside.
To confirm our statement, the RSI indicator displayed a bullish divergence (when price is making lower lows but the RSI is making higher highs) and the MACD indicator is signalling a buy signal with bullish momentum coming back.
Nasdaq-100 / 1D-chart
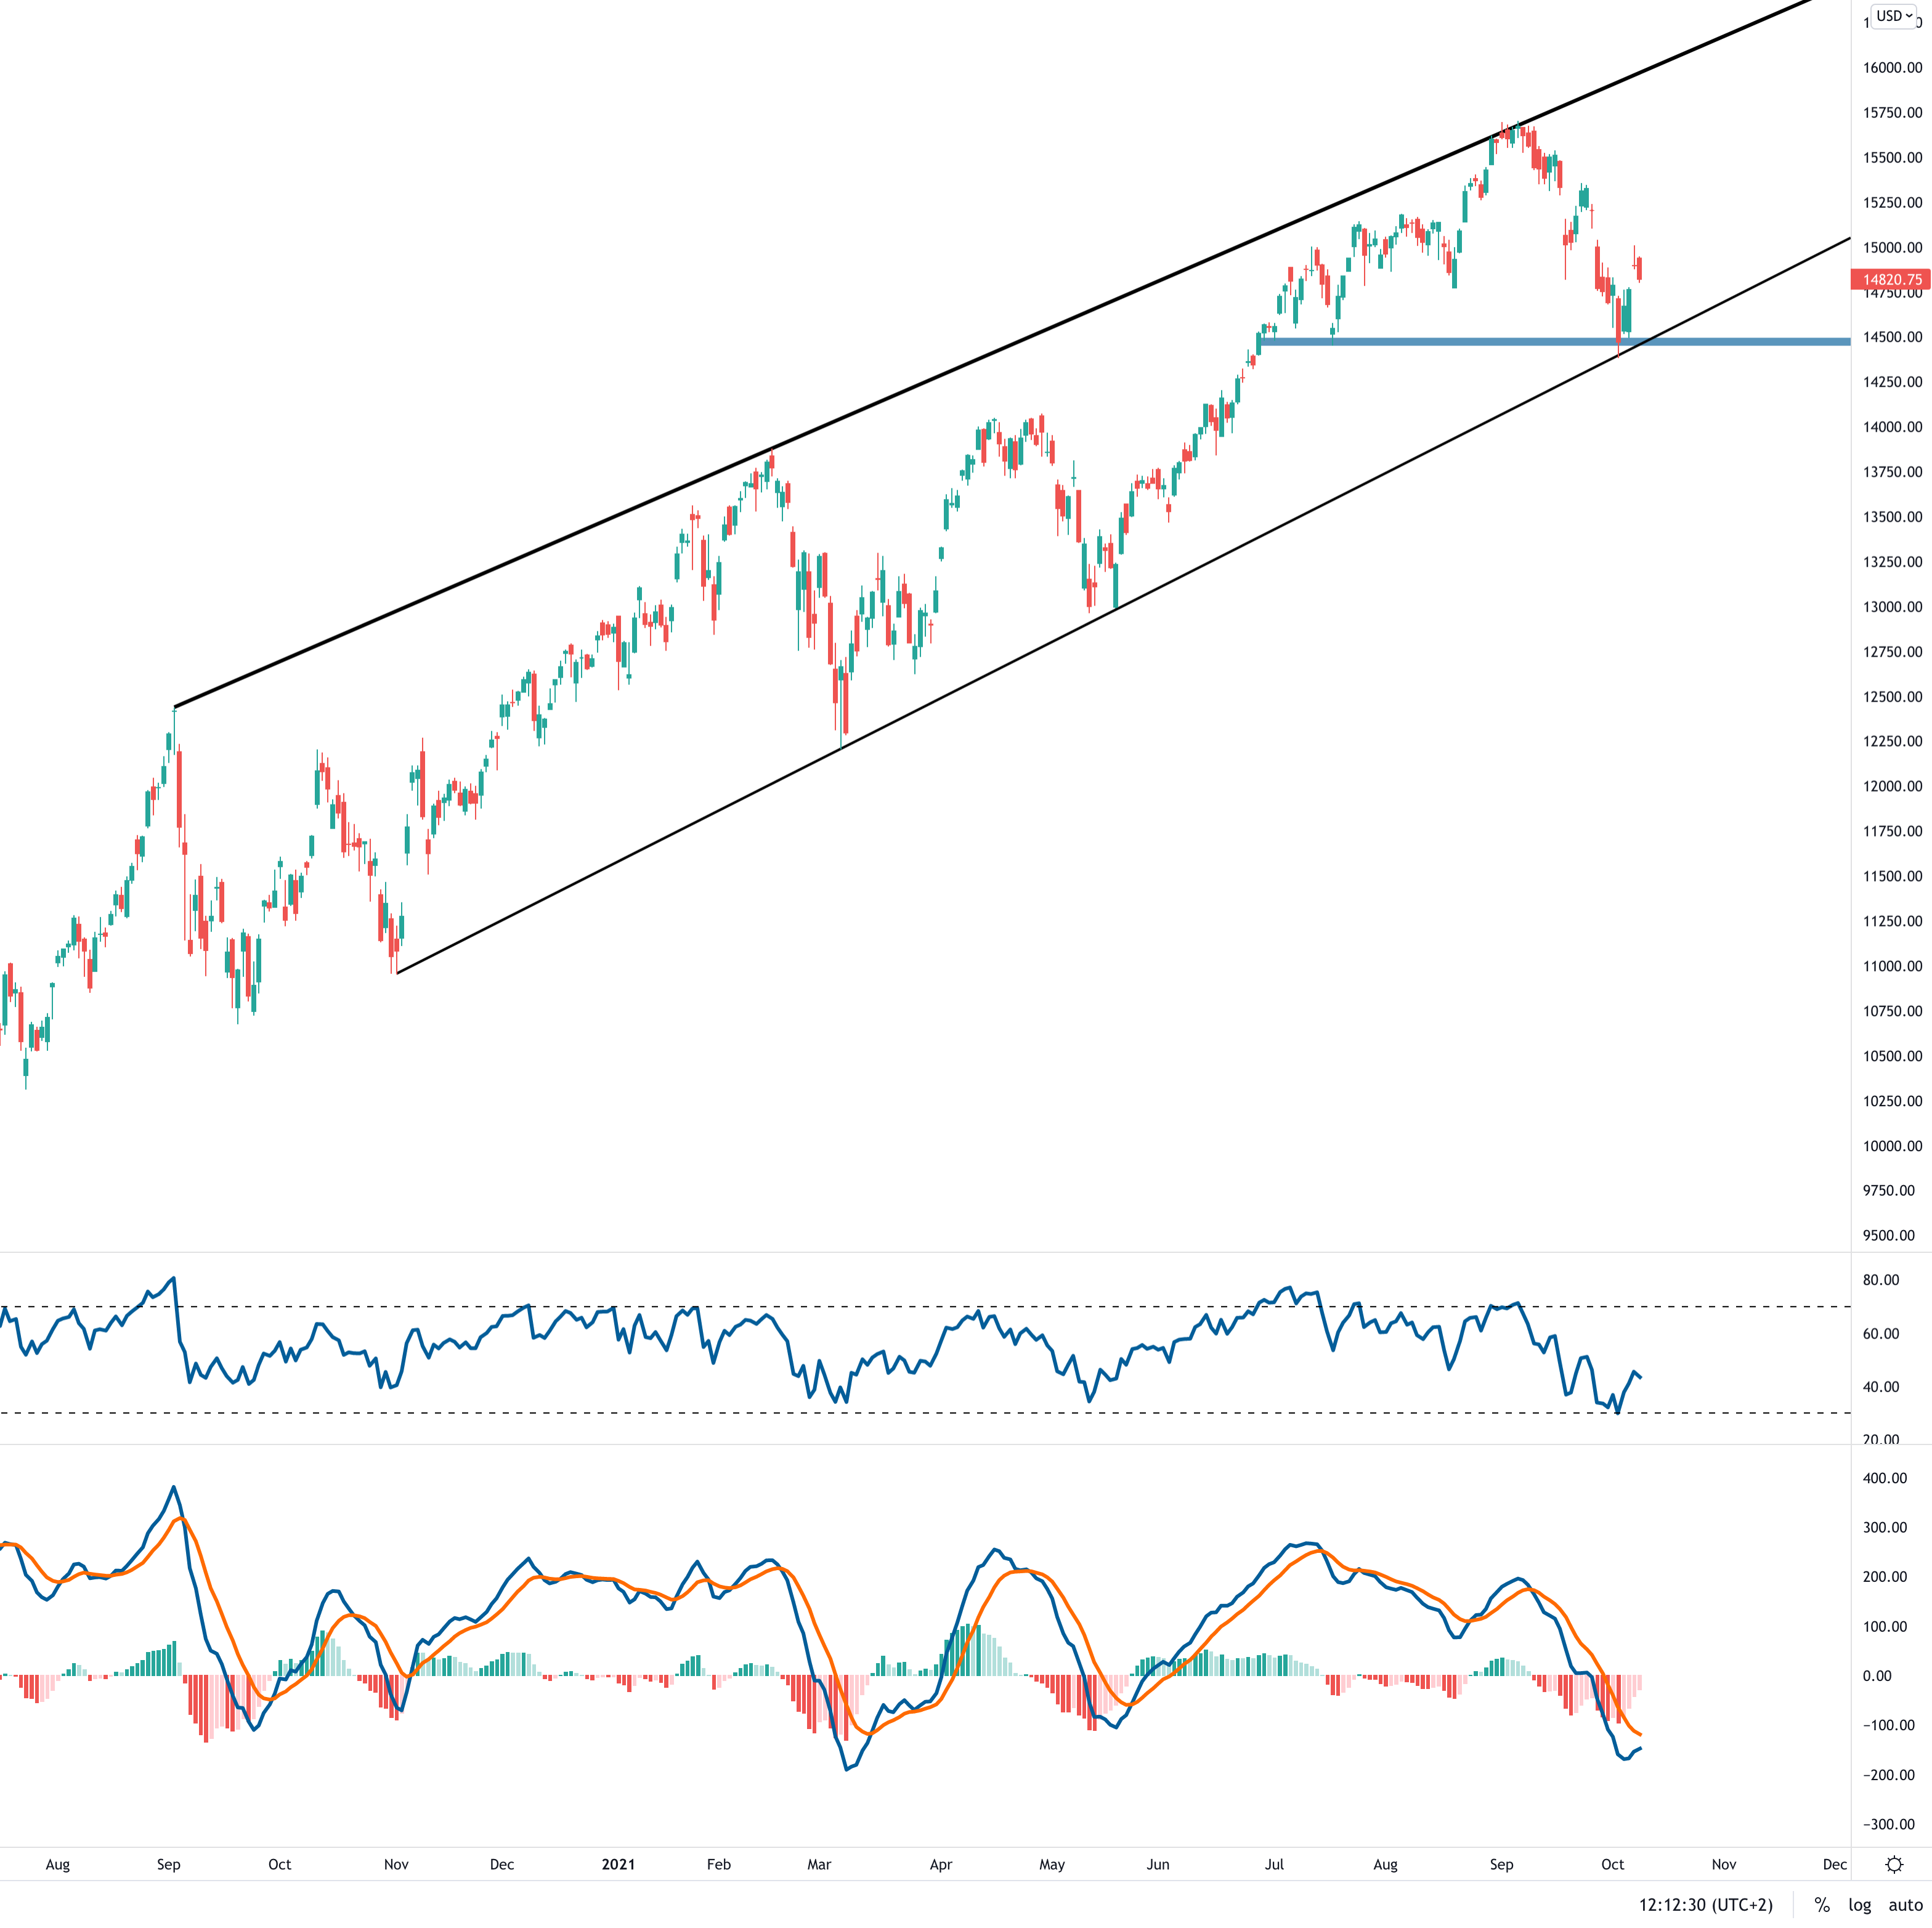
With the Nasdaq-100 index we also expect short-term upside. The price had recently a tough on local resistance and is still trading in a rising channel. With the RSI and MACD on lower levels, we expect that investors see this as a buying opportunity.
Bitcoin / 1D-chart
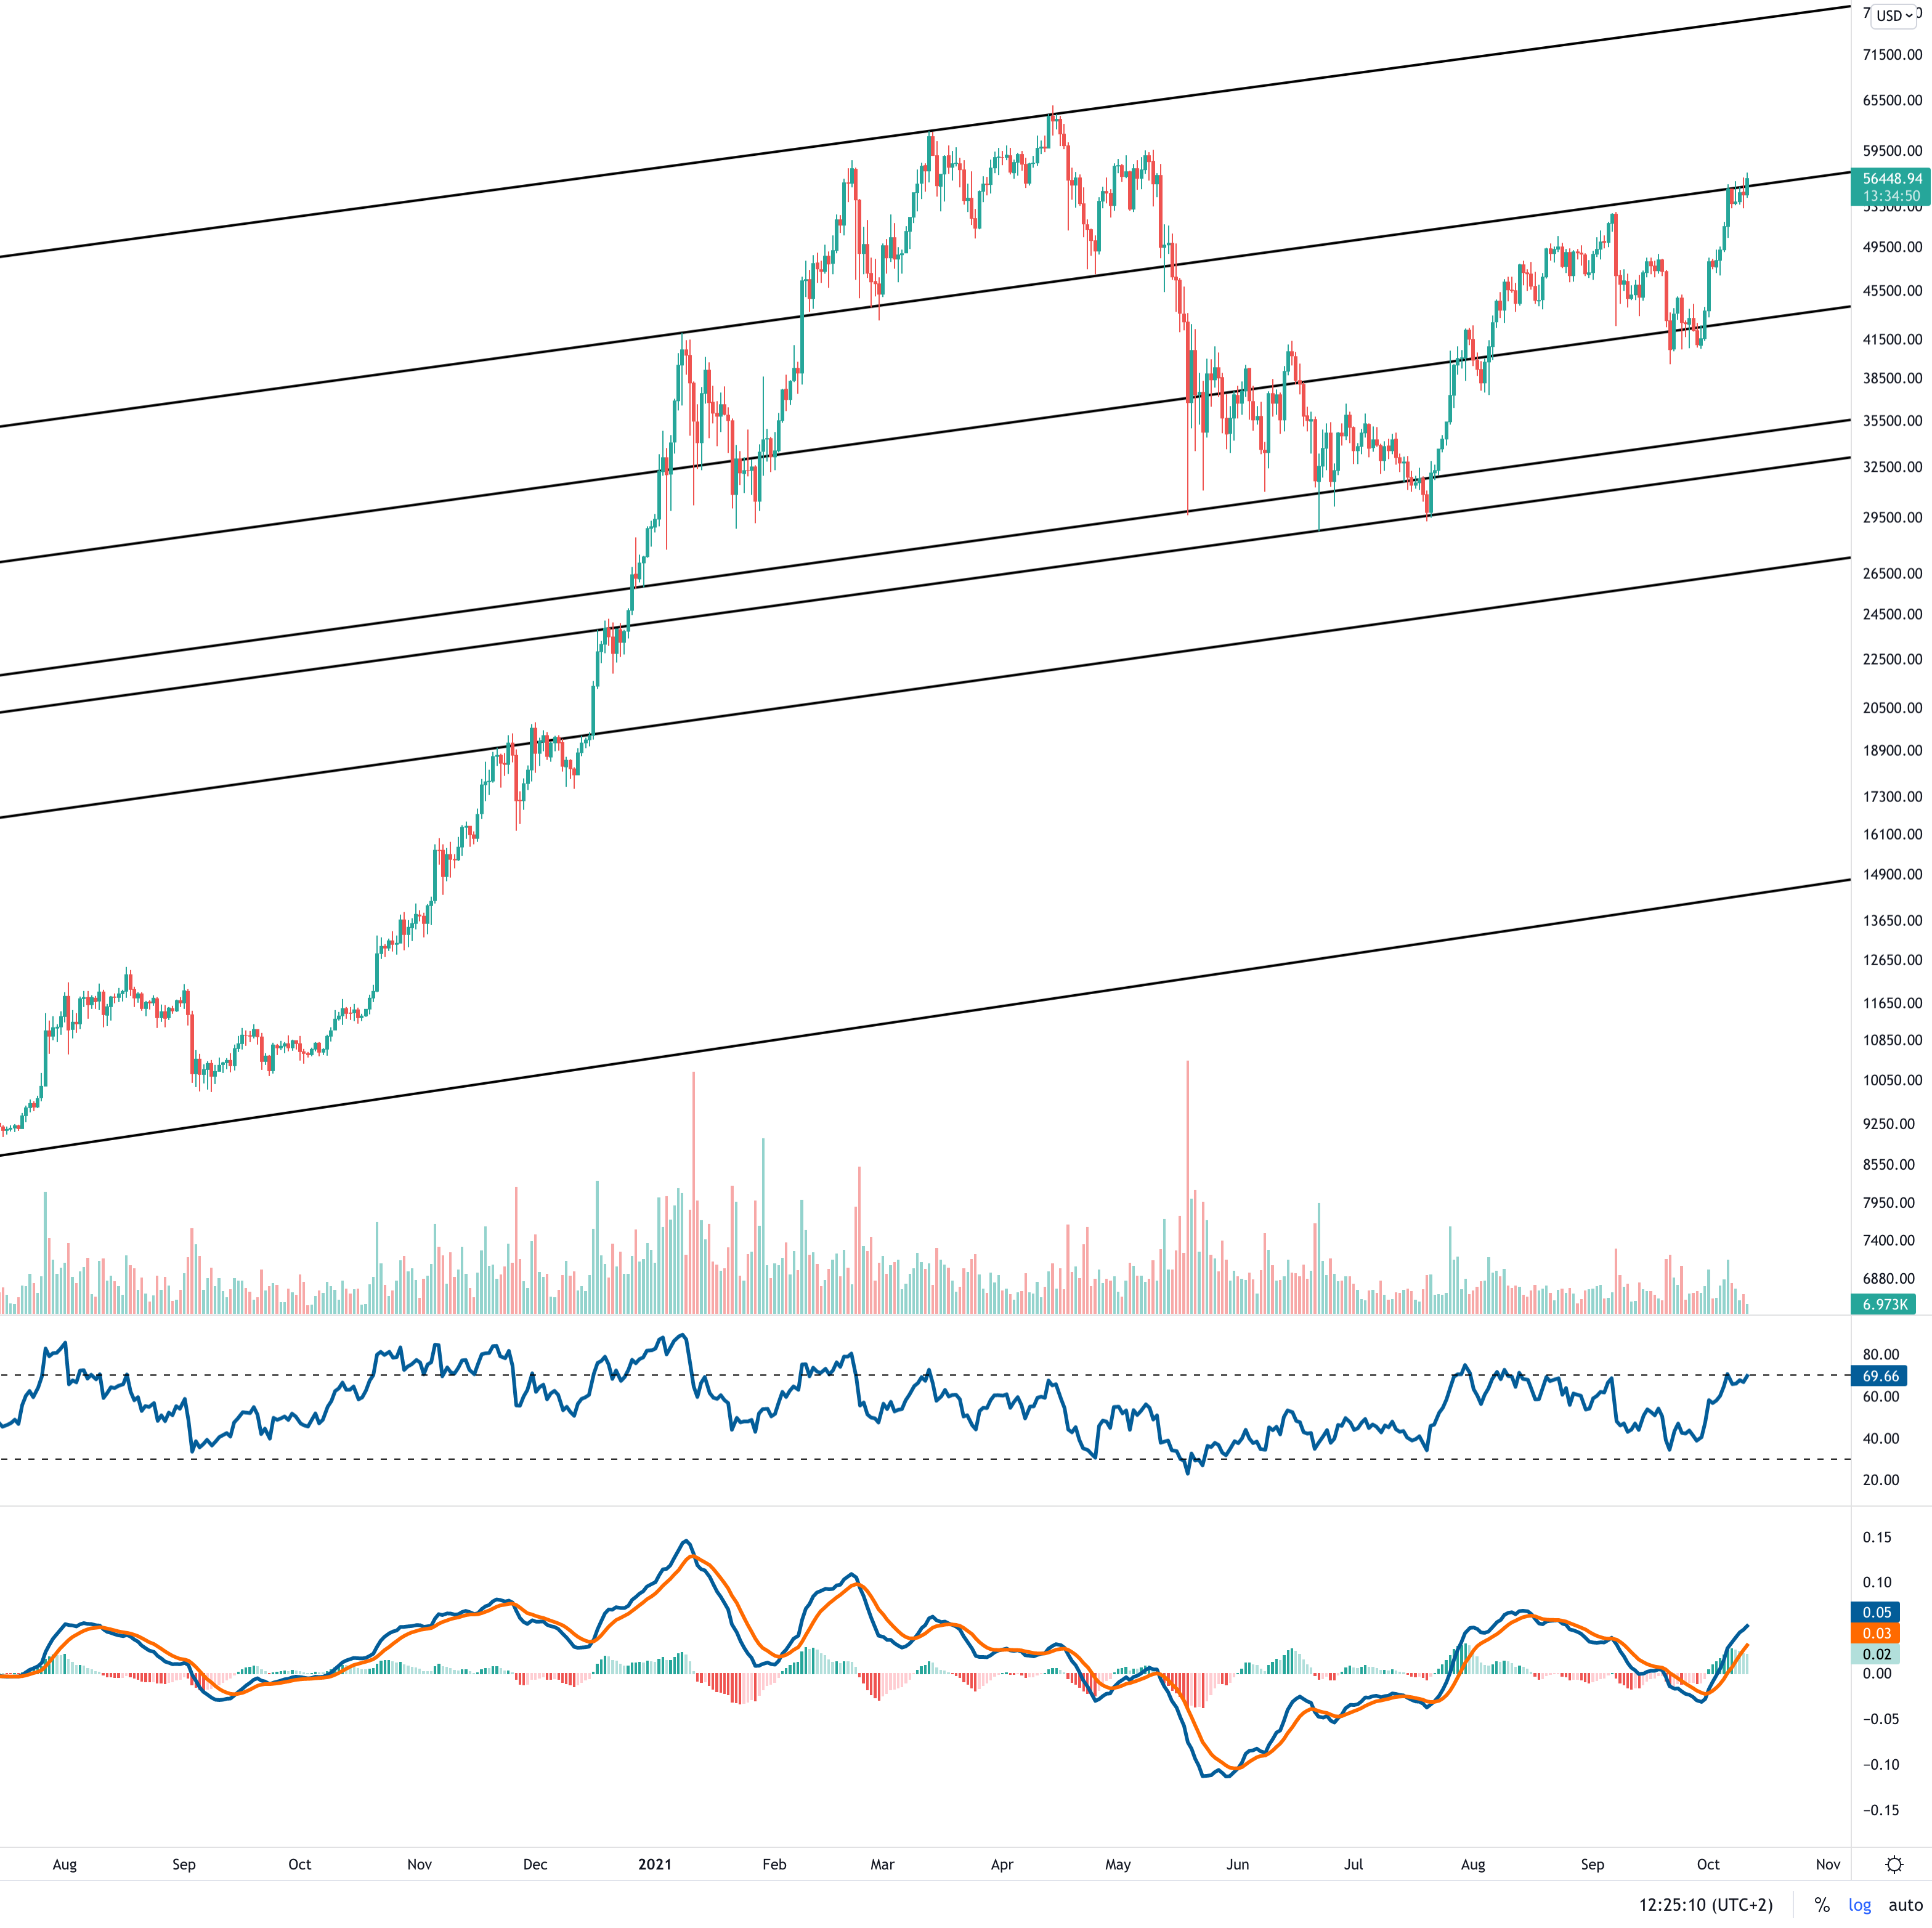
We end our technical analysis with our favourite cryptocurrency, Bitcoin. At the time of writing Bitcoin is trading at $56k and is fighting to stay above our local trend line.
What we like to see is that Bitcoin stays above our local trend line and consolidates around it to cool off the technical indicators, because the RSI is at the overbought zone and the MACD indicator is curling back down (bullish momentum is slowing down).
But if bitcoin drops below again, we expect short-term downside and waiting for a buy opportunity around $48k.
We would like to thank you for your time reading our newsletter, if you found something interesting, consider to subscribe and share this newsletter with your friends. We would highly appreciate it!
Never mis out on big market news by following us on Facebook, Instagram or Twitter.