

Litecoin - Back to $400
Litecoin - Back to $400
Dear investors,
Welcome back to Thursday’s free newsletter, where we discuss investable assets by their history, current and future outlook with technical analysis.
In today’s newsletter we will discuss the decentralised cryptocurrency Litecoin. With Litecoin back above $200, ending its sideways movement for the several months. We are providing our technical analysis to see if the time is right to invest in Litecoin.
Litecoin Explained
Litecoin is a peer-to-peer Internet currency that enables instant, near-zero cost payments to anyone in the world. Litecoin is an open source, global payment network that is fully decentralized without any central authorities.
Litecoin was created with the aim of improving the concept of bitcoin, involving some technical differences. These differences include the algorithmic function (Scrypt versus SHA-256 with bitcoin), a higher maximum number of coins, faster confirmation times and different addresses. Due to its shared source code with bitcoin, the development and continued decentralization of bitcoin is supported by the Litecoin Project.
Specifications
Time-stamping scheme: Proof-of-work
Hash function: Scrypt
Block reward: 12.5 LTC (approximately till August 2023),
halved approximately every four years
Block time: 2.5 minutes
Circulating supply: 66,752,615 LTC (20 August 2021)
Supply limit: 84,000,000 LTC
Litecoin features faster transaction confirmation times and improved storage efficiency than the leading math-based currency. With substantial industry support, trade volume and liquidity, Litecoin is a proven medium of commerce complementary to Bitcoin.
Litecoin - Daily Chart
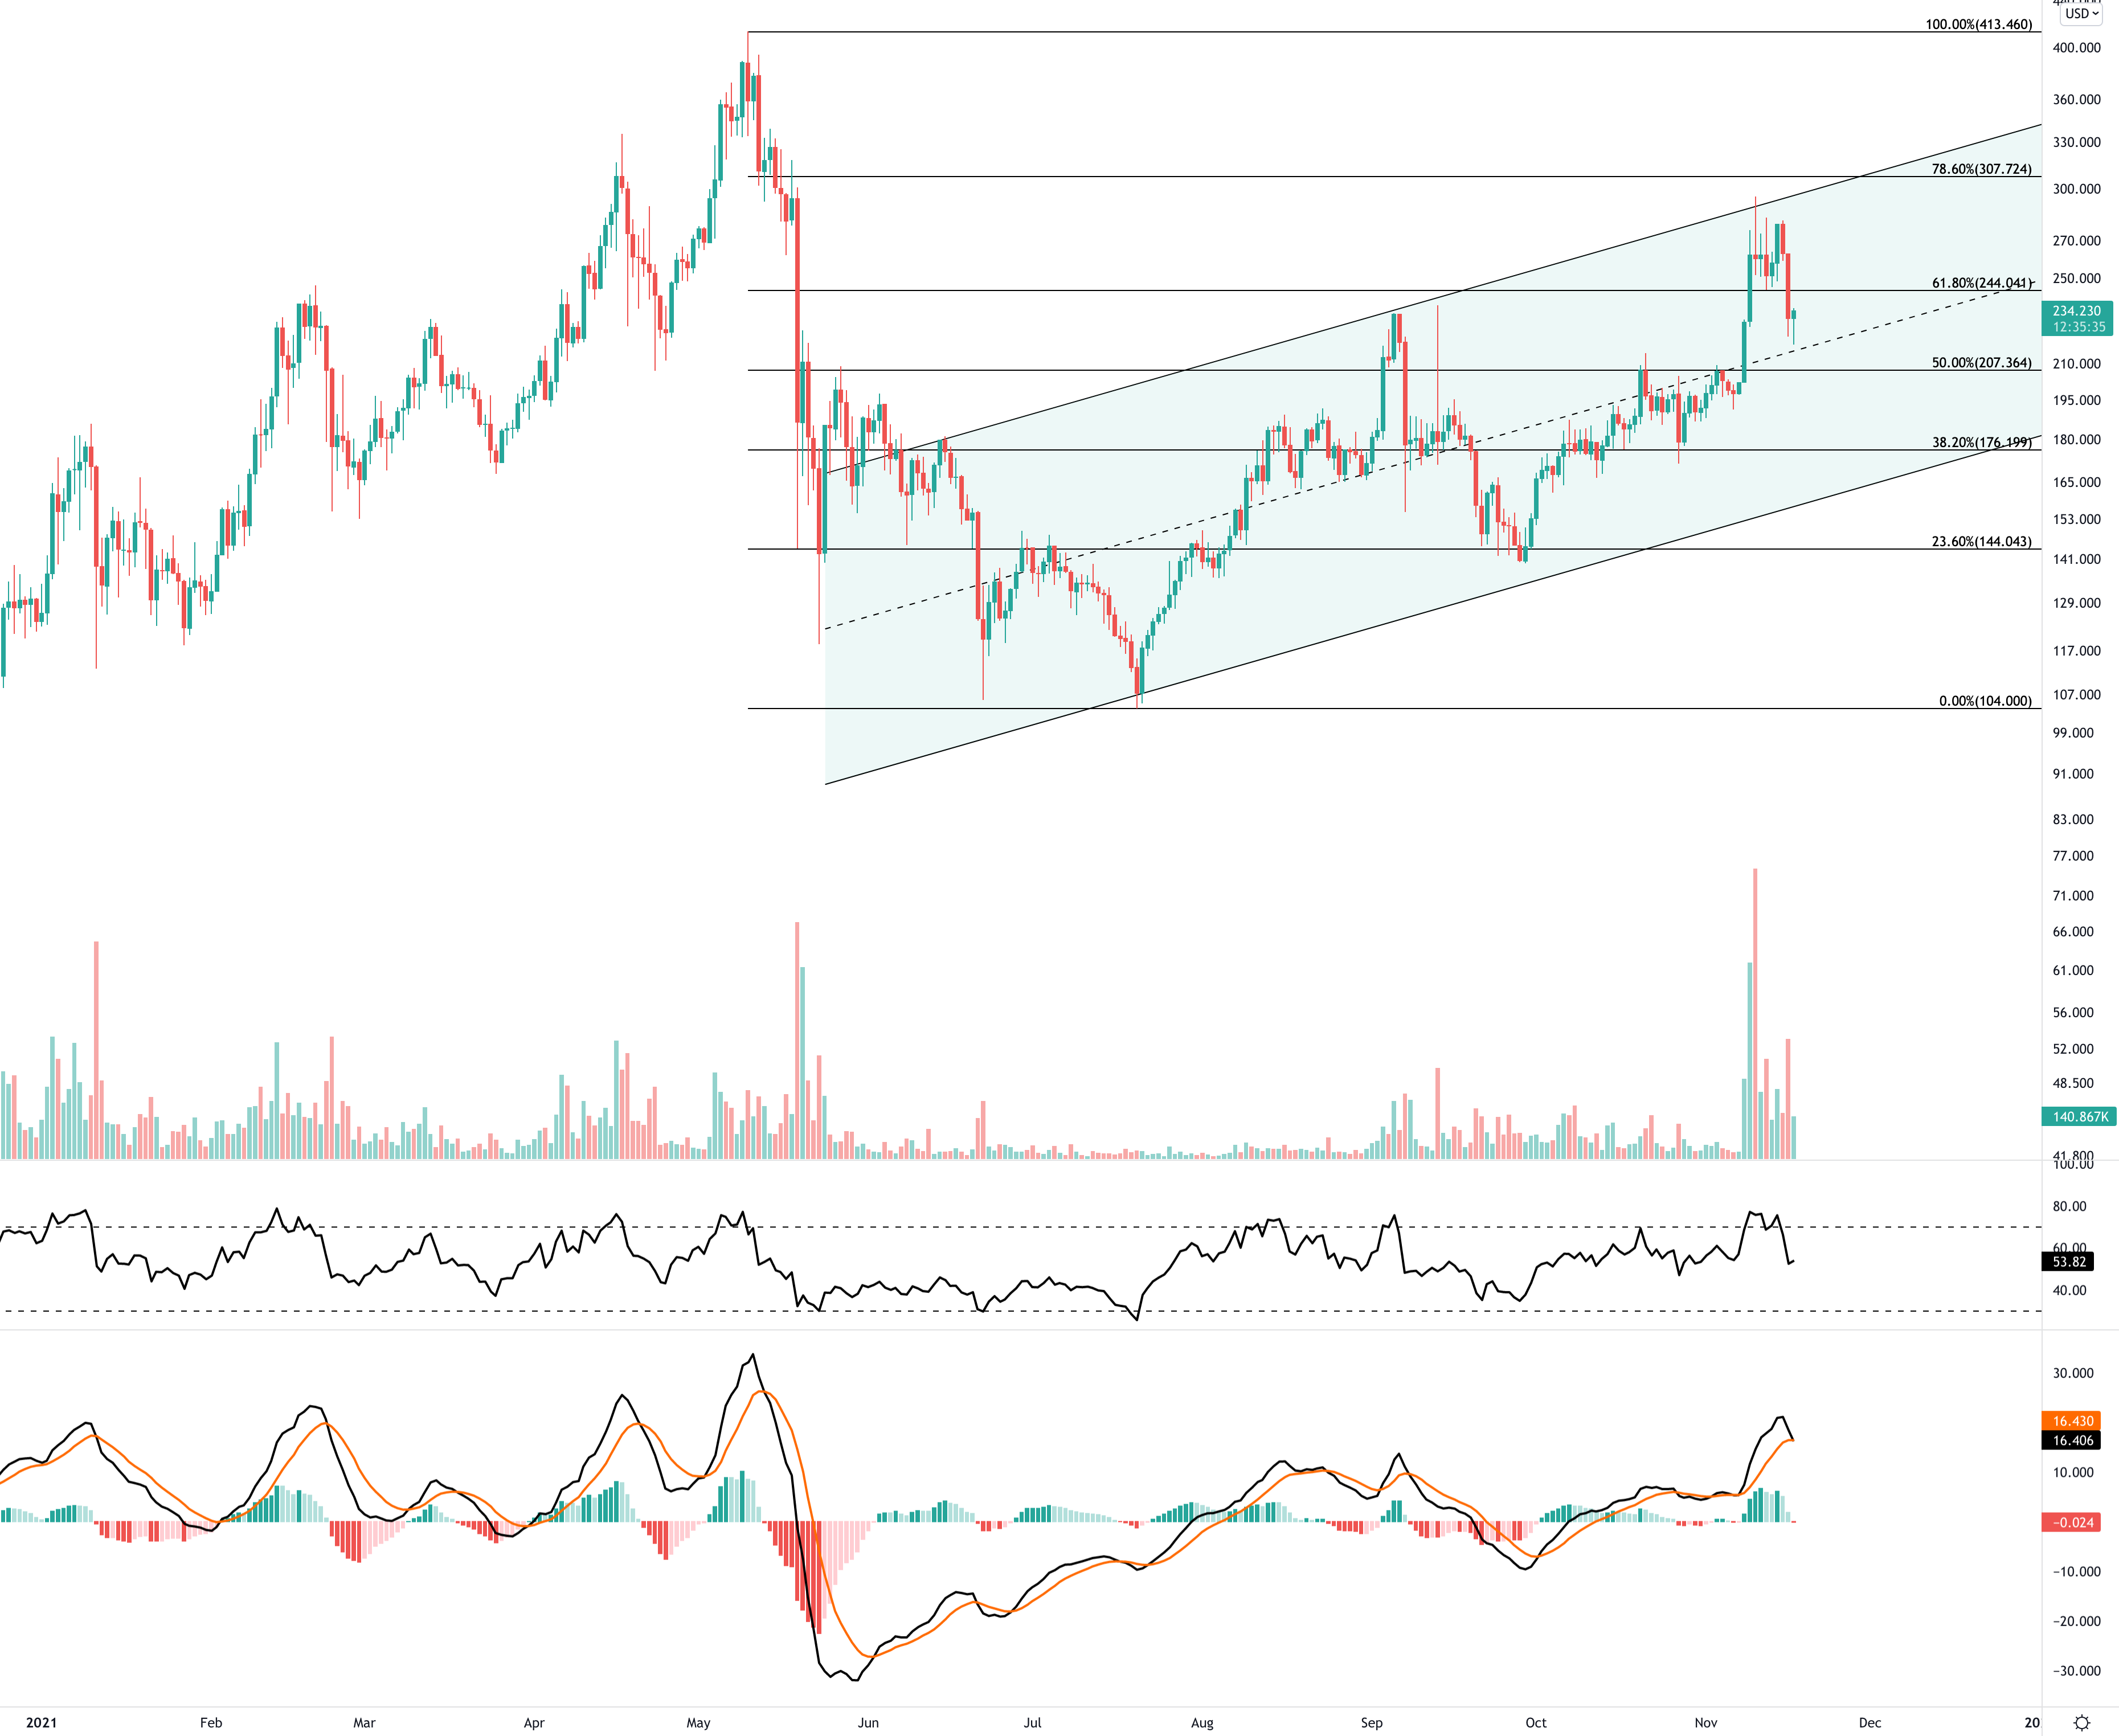
At the moment of writing, Litecoin is trading around $234 just after a steep pullback of 22%. With this pullback, the RSI indicator cooled off significantly and crossed the MACD into bearish momentum. We expect that the daily candle will close a little higher to turn that MACD crossover back to the bullish side.
If we focus at the chart, we can see (indicated in green) that Litecoin’s price is trading in an ascending channel for the past several months. With the recent reaction on the upper trend line, a short term pull back occurred confirming strong resistance.
If we would invest in Litecoin in the coming days, we see two potential levels for entering positions:
If the price decides to jump back above local resistance ($244) and closes above it. We would enter on a confirmed retest, that would make the now resistance into a support line.
If the MACD’s momentum drags the price down first, we would wait for the next support which is around $207. The RSI would be lower than it is now (which is good for the next upswing) and we believe more traders would see that price to be an acceptable position to make an investment.
Litecoin - Weekly Chart
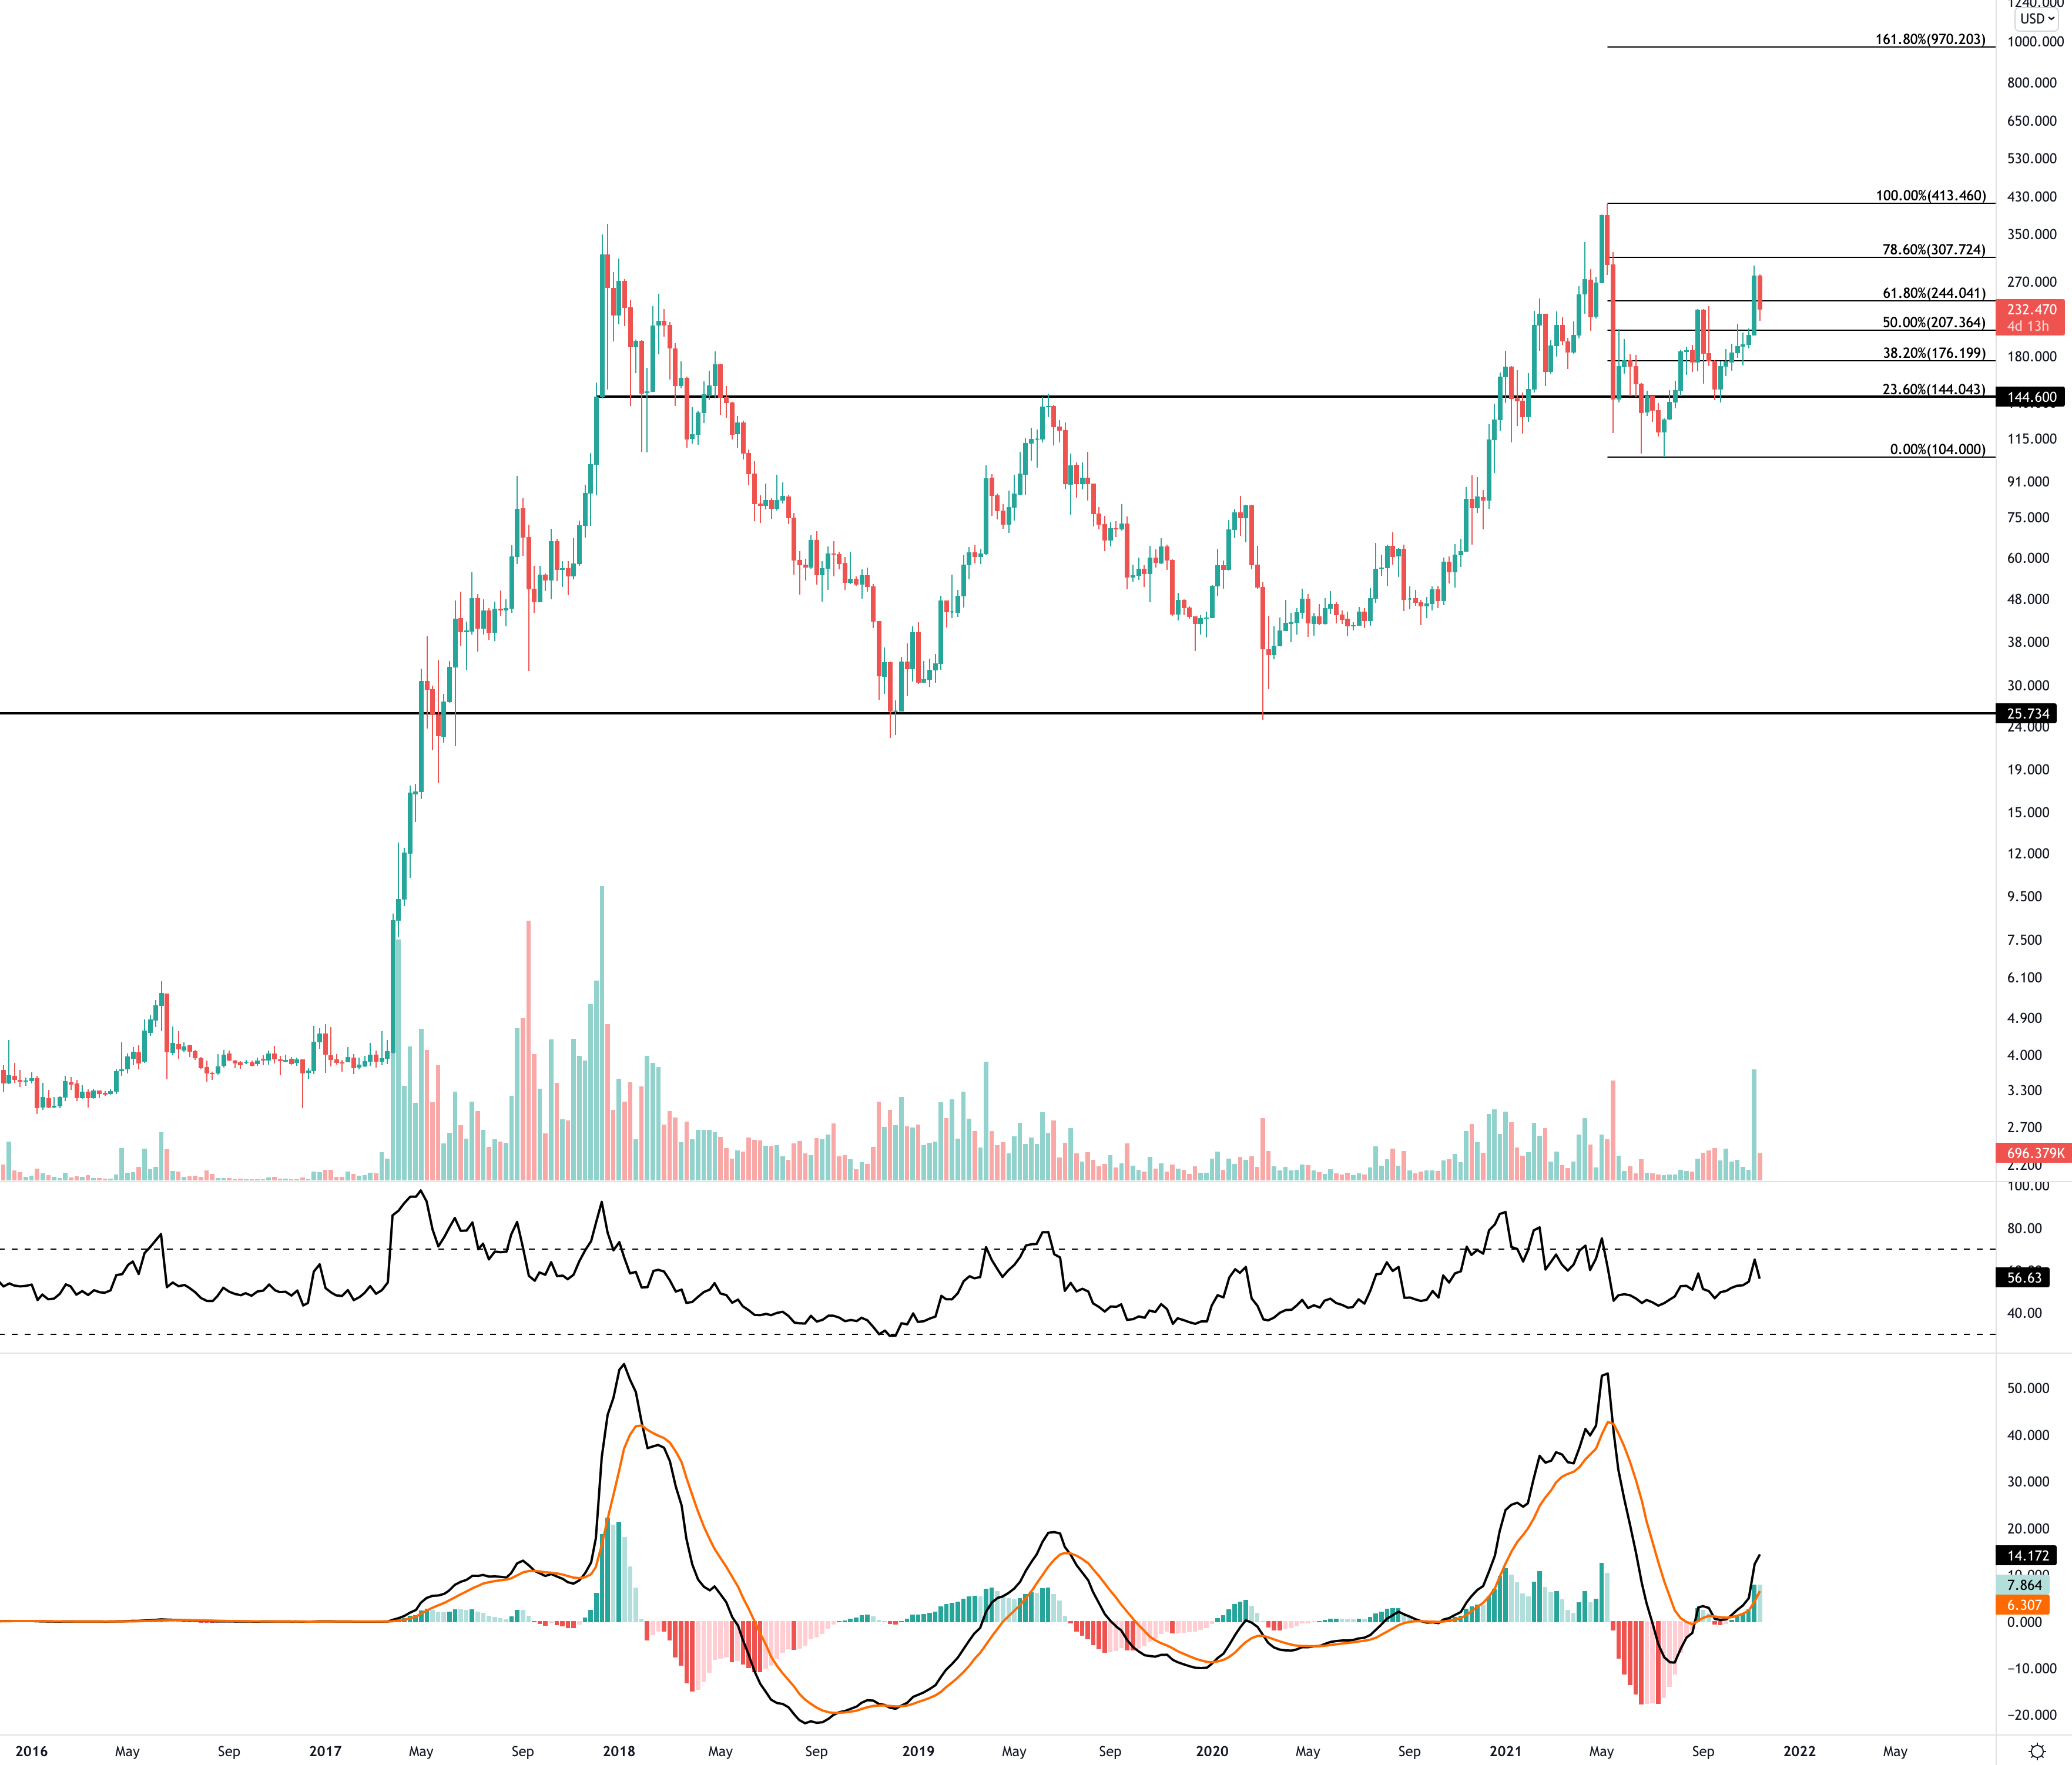
If we zoom out to the weekly timeframe, we can set all the ‘short-term noise’ aside and focus on the long-term structure of Litecoin’s price.
On the MACD indicator are two huge bullish swings displayed, the only difference we see between those spikes is that in this year Litecoin recovered much faster and is already back into bullish momentum. Indicating that this bull run is not over yet.
With the bullish structure Litecoin is currently in, we expect a second reaction at this year’s all-time high with higher prices to follow.
We would like to thank you for your time reading our newsletter, if you found something interesting, consider to subscribe and share this newsletter with your friends. We would highly appreciate it!
Never mis out on big market news by following us on Facebook or Twitter.