

Gold - About to double in value?
Gold - About to double in value?
The best mid-term investment of 2022.
Dear investors,
Welcome back to Thursday’s free newsletter, where we discuss investable assets by their history, current and future outlook with technical analysis.
While everybody is focused on the stock market and cryptocurrency, we are going back to the original form of investment. With gold trading in a technical pattern for longer than a decade, we believe gold is making itself ready for the next big rally.
Topics we will discuss:
Why gold?
Gold’s power
Technical Analysis
Conclusion
Why gold?
Gold is one of the best assets to have in times of uncertainty. When there is fear in the market the stock market tends to fall down, however gold remains more stable because of its history as a store of value and its scarcity advantage.
While gold is an old form of money what we don't use anymore other than in products and as a store of value. It is still relevant in current times because of the danger in fiat currencies.
The problem with fiat currencies is that central banks can create more of it whenever they need it (mostly for political purposes or to finance wars). But if the printing of currency gets out of hand by getting more into debt, causing (hyper)inflation along the way, people are questioning the value of the currency and will use another form of payment. If that happens on a bigger scale, the whole currency (like the dollar) collapses. Starting a new age with a commodity-based currency standard, like gold has been for decades.
The power of gold
The price of gold mainly rise when inflation accelerates, as the demand for goods and services increases, the price of goods and services rises. This all causes the price of commodities to increase, because commodities are used to make those goods and services.
The price of gold often rise with inflation, this asset class can often serve as a hedge against the decreased buying power of a currency.
In addition, yesterday was the monthly announcement of new inflation data. Here are the highlights:
The consumer price index surged 6.2% from a year ago in October, the most since December 1990.
Core inflation, stripping out food and energy, increased 4.6%, the fastest gain since November of the same year.
When the inflation data was announced, gold’s price increased by 1.7%.
Gold — Daily Chart
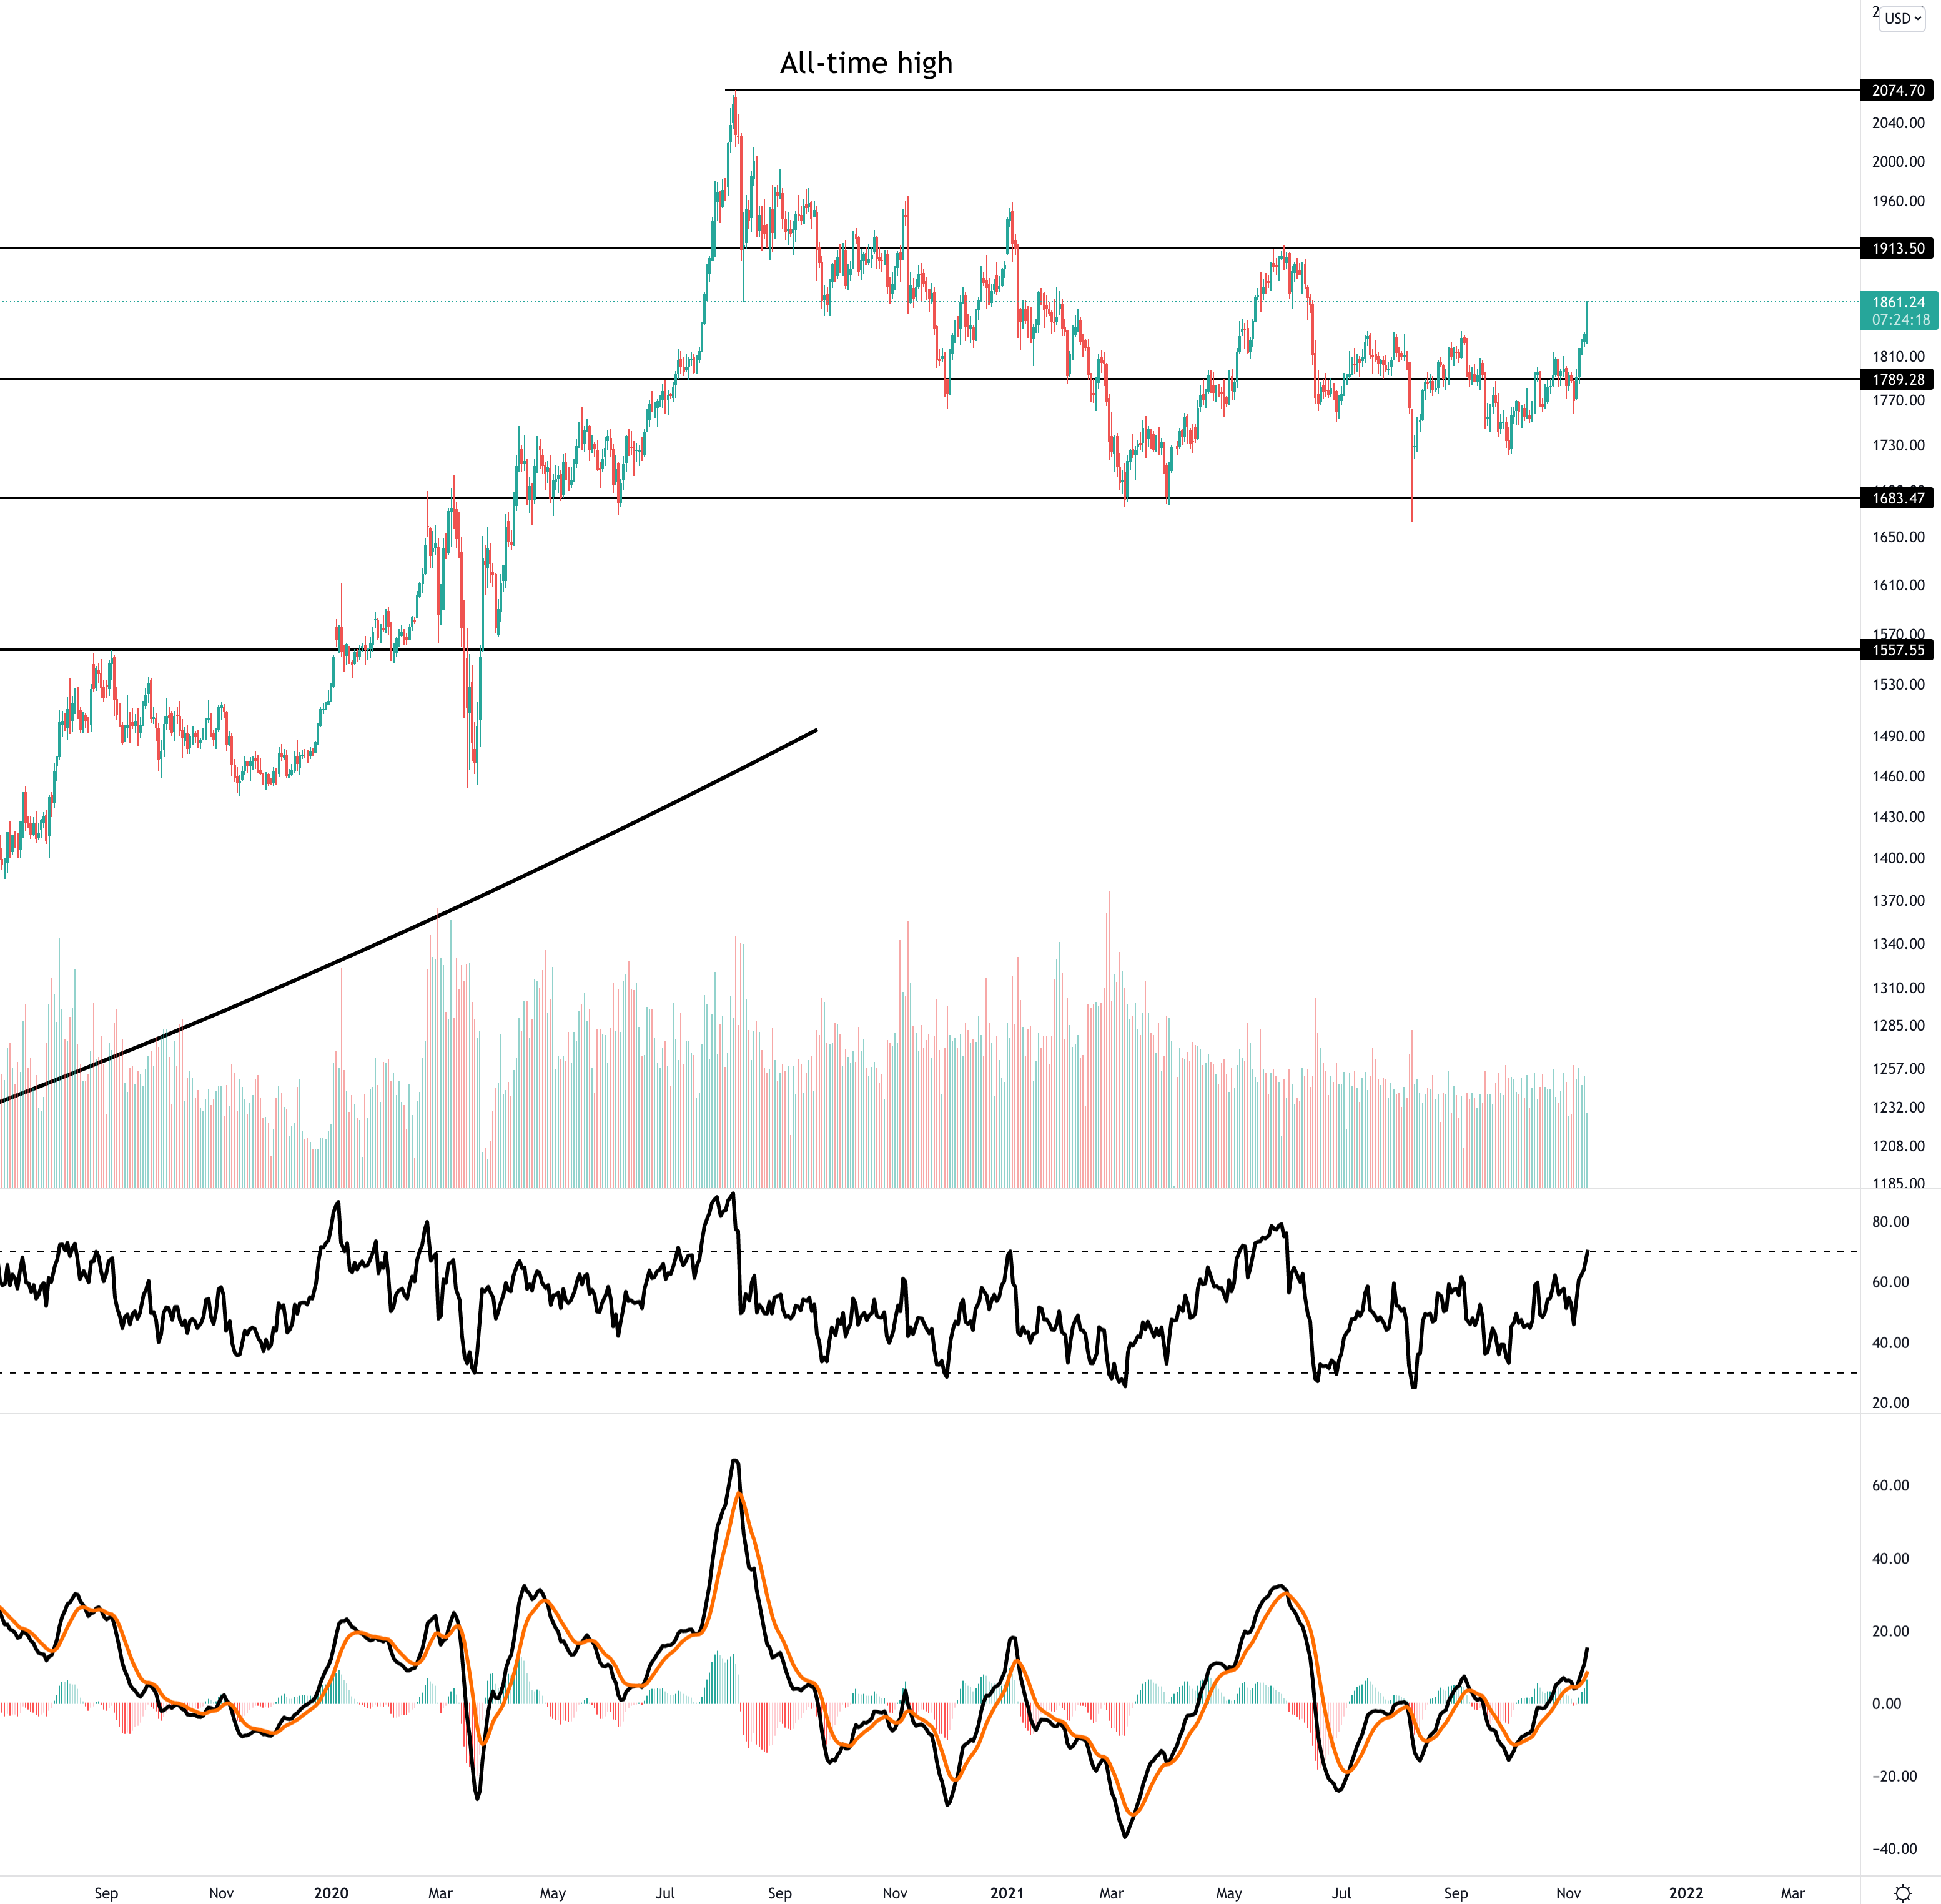
Because of the inflation data, gold moved sharply upwards and is at the moment of writing trading at $1861. The price of gold is now making higher highs since the end of June, a potential start of a new uptrend.
If we wanted to buy gold in the near term, we would wait for these two potential opportunities before entering positions:
If gold’s price is going to continue this uptrend, we would wait to see if gold can break the $1913 resistance line. If so, we would enter positions on a confirmed retest on the same trend line, but now acting as support.
If the price of gold increased further but managed to get rejected on the $1913 trend line acting as resistance, we would wait if the price gets back to around $1830, lowering the high RSI reading.
If this was a fake breakout towards the upside, we would wait for a retest around $1789.
Gold — Weekly Chart
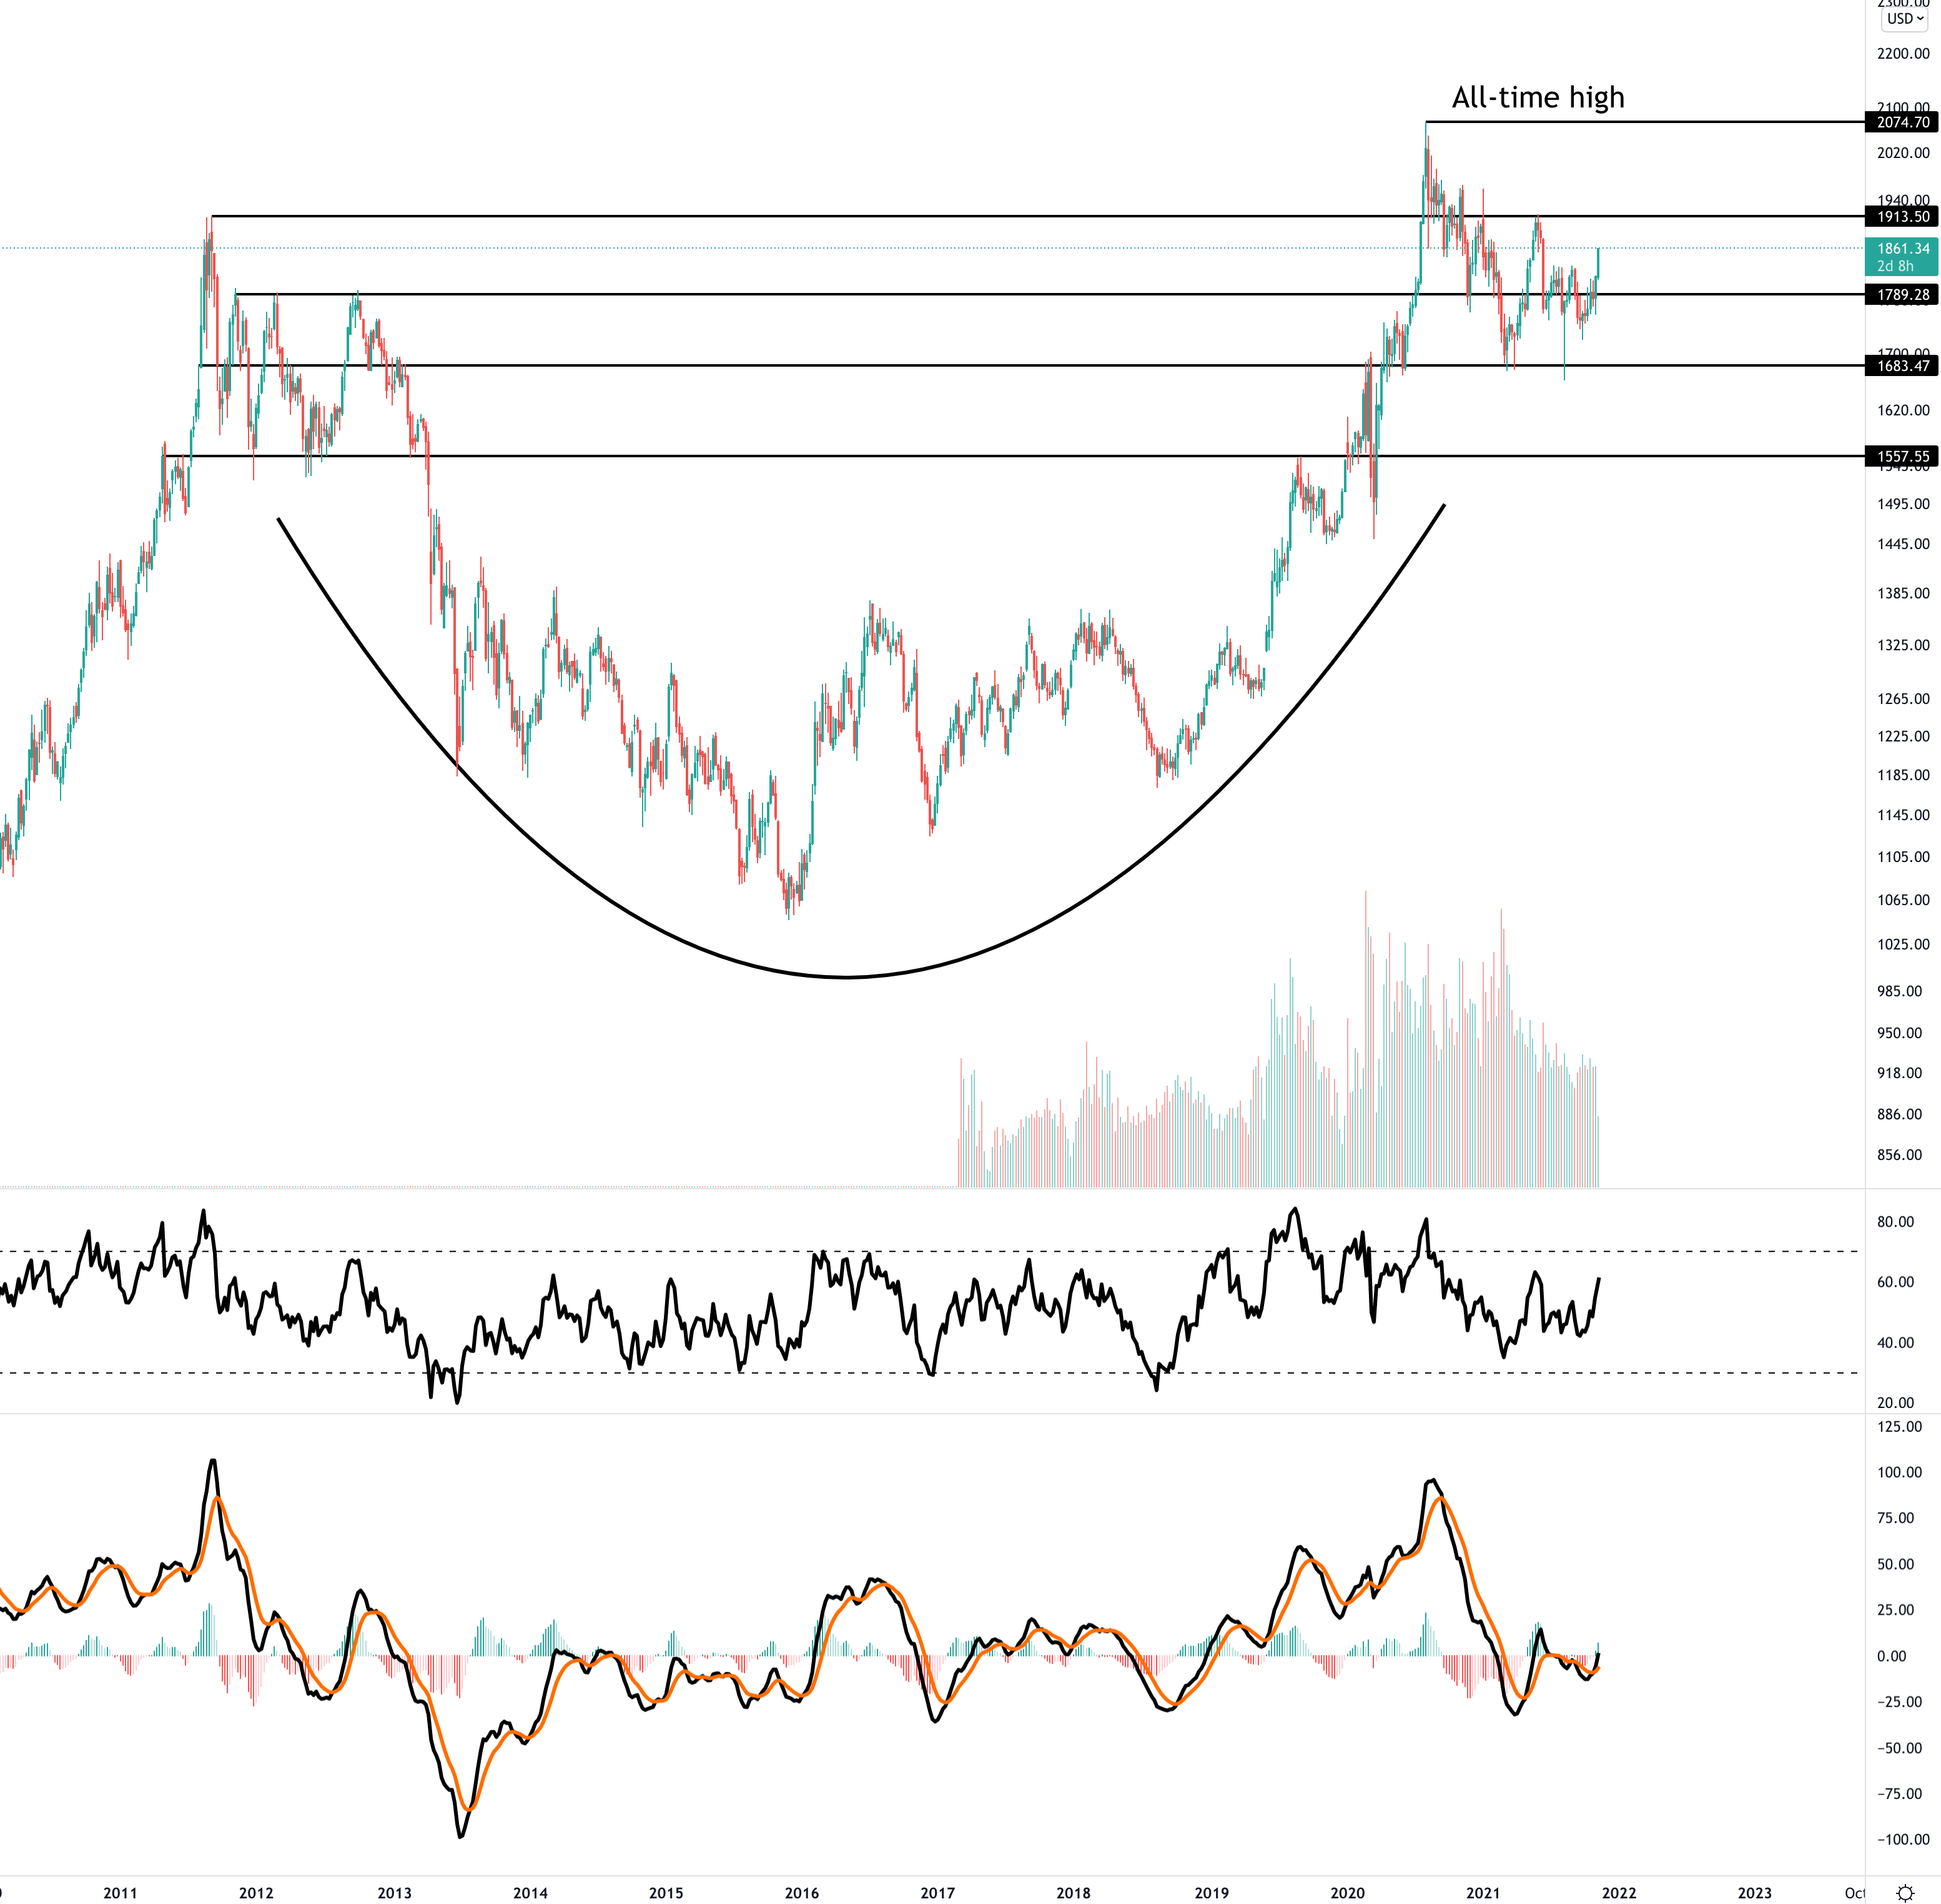
If we look back in history, we see a decade old cup and handle pattern. The pattern is in its final stage as the handle formation is currently being formed with lower volume.
The next thing we are waiting for is volume to increase and the price breaking its last resistance ($1913) before making its way back towards all-time highs.
If we focus on the long-term technical indicators, we can see that the RSI is making higher highs and the MACD recently crossed back to bullish momentum. Another great sign of mid-term bullish price action.
A cup and handle pattern is a chart pattern where the price drops over a period of time to create the ‘cup’, then if the price is back to prior value, it falls by a smaller percentage (creating the handle) and should later break through to the upside. It is known as an indication of bullish sentiment in the market and possible further price increases.
Conclusion
The Federal Reserve starts their tapering process by the end of November by decreasing the amount of bond purchases they buy each month. The Federal Reserve currently buys every month $120 billion in bonds to stimulate the economy and the financial markets.
The first step in the tapering process is to bring the $120 billion in bond purchases back to $105 billion, a decline of $15 billion per month. We expect that the stock market’s momentum will slow down when bigger steps in tapering are made in the coming weeks to months. When that happens, we believe that people are not satisfied anymore with the stock market’s growth and are considering to take profit. And when too many investors are about to take profit, we expect that the indexes and high valuation stocks will fall significantly.
If all that currency finds its way back into the economy, velocity and inflation will both increase and gold investors will benefit from it.
We would like to thank you for your time reading our newsletter, if you found something interesting, consider to subscribe and share this newsletter with your friends. We would highly appreciate it!
Never mis out on big market news by following us on Facebook, Instagram or Twitter.